Book-to-Bill Ratio: Why Big Backlogs Can Signal a Peak
Surmount Blogs
Learn what the book-to-bill ratio reveals about order backlogs and why record numbers can signal a peak.

Book-to-Bill Ratio: Why Big Backlogs Can Signal a Peak
A record order book sounds like the safest thing a business can report. It suggests years of contracted revenue, customers lined up, and a moat that locks in future sales. Yet in cyclical industries, the biggest backlogs often appear just before demand turns.
The book-to-bill ratio helps explain why. It measures whether new orders are replacing the work a company ships out. When that measure starts slipping, a record backlog can keep headlines positive long after underlying demand has cooled.
Here's how the metric works, why backlogs tend to peak late, and how a systematic approach keeps business quality and cycle risk in separate columns.
What Is the Book-to-Bill Ratio?
The book-to-bill ratio compares the value of new orders obtained with the value of goods and services billed over the same period. The formula is simple:
Book-to-bill = new orders ÷ revenue billed (for the same period)
How to read the result:
Above 1: orders are arriving faster than work ships, so the backlog grows
At 1: new orders are replacing shipments one for one
Below 1: shipments are outpacing new orders, so the backlog shrinks
For example, a manufacturer that books $90 million in orders while billing $100 million posts a ratio of 0.9. Its backlog may still look enormous. It's just being drawn down.
What an Order Backlog Does and Doesn't Tell You
An order backlog is the stock of work booked but not yet delivered. The book-to-bill ratio is the flow that fills or drains it. That distinction matters:
A backlog shows how much work is already committed
It doesn't show whether customers are still ordering at the same pace
It can stay near record levels for quarters after bookings slow, because large backlogs drain gradually
Why Cyclical Stocks Post Record Backlogs Near the Top
Cyclical stocks tie their earnings to customers' willingness to commit capital, which is why market leadership tends to rotate between sectors as the cycle turns. Customers tend to place the most orders when confidence is highest, which is usually late in an expansion, when capital spending plans are at their most ambitious. Those orders then take months or years to deliver, so the backlog keeps growing into a period when conditions may already be weakening.
Why the Backlog Is a Lagging Indicator
A backlog records decisions customers made in the past. That's what makes it a lagging indicator:
It reflects commitments made months or years earlier
It can keep rising after new orders have already turned
It only falls once deliveries outpace a shrinking stream of new business
What Unfilled Orders Data Shows Across Industries
The 2007–2009 recession offers a clear example. The National Bureau of Economic Research dated the peak in U.S. economic activity to December 2007, marking the start of the recession. Yet total U.S. manufacturers' unfilled orders kept climbing:
December 2007: about $944 billion
September 2008 (peak): about $1.02 trillion
December 2009: about $825 billion, roughly 19% below the peak
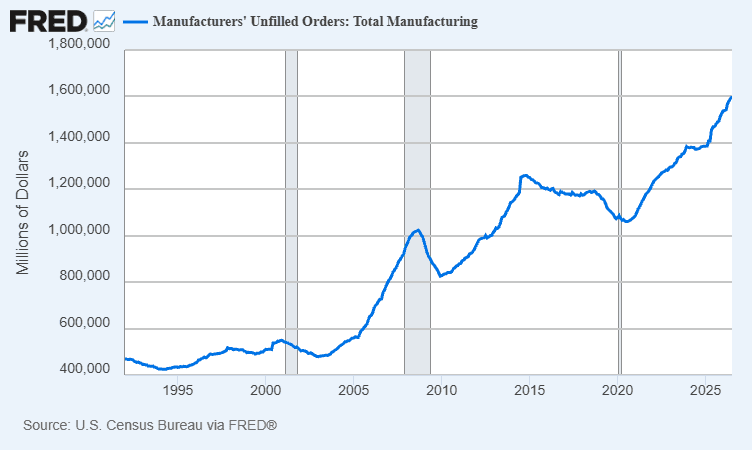
In other words, the aggregate backlog hit a record nine months into a recession, then contracted sharply.
The same series stood near $1.6 trillion in July 2026, the highest level in data going back to 1992. A record level on its own doesn't signal a turn. The 2008 episode simply shows why the direction of new orders can matter more than the size of the backlog.
Cancellations: The Fine Print Behind the Backlog
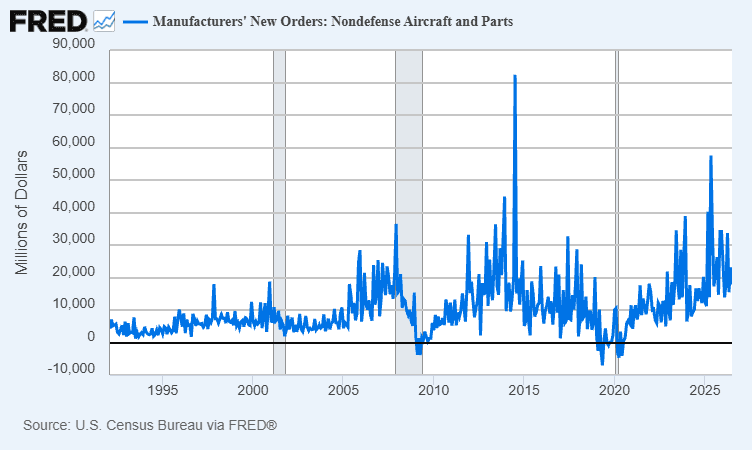
A backlog isn't guaranteed revenue. The U.S. Census Bureau reports new orders net of cancellations, which means reported orders can turn negative.
That happened in commercial aerospace in 2020. Net new orders for nondefense aircraft and parts turned negative in March, April, and June, meaning cancellations outweighed fresh bookings in those months.
A backlog can shrink without a single delivery through:
Customer cancellations or deferrals
Contracts with flexible exit clauses
Orders scaled back when customers' financing tightens, a shift credit markets often reveal before stocks react
A Competitive Moat Doesn't Cancel the Cycle
This is the "cyclical moat" trap, and it catches experienced investors. A company can hold a genuine competitive moat, such as proprietary technology, regulatory approvals, or dominant market share, and still depend on customers placing new orders.
The moat decides who wins the orders
The cycle decides how many orders exist to win
A dominant supplier to an industry that stops ordering still sees its bookings fall, and that risk compounds when a portfolio leans heavily on one industry, a form of concentration risk. Business strength and revenue timing are two separate questions, and a record backlog tends to blur them.
How Rules-Based Investing Separates the Moat From the Cycle
Headline backlog figures tend to reassure. Rules-based investing reduces the influence of those headlines by defining in advance which signals matter and how they're weighed. Late-cycle warning signs a systematic framework might track include:
A book-to-bill ratio below 1 for consecutive quarters, even while the backlog stays large
Backlog growing slower than revenue, meaning coverage of future sales is thinning
Rising cancellations or deferrals in company disclosures or industry data
Valuations that assume peak margins will last
Weakening price trends, the core input behind momentum investing strategies, before fundamentals visibly roll over
Fixed rules don't pinpoint the exact top of a cycle, and no signal works every time, especially one tuned too closely to past data. What they can do is apply the same criteria consistently, rather than letting a record backlog headline override evidence that demand is changing. That discipline matters most at exits, where most investors get the decision systematically wrong.
The Bottom Line
A big backlog shows where demand has been, not where it's heading. The book-to-bill ratio offers a more timely view because it tracks whether new orders are still replacing shipments. In cyclical industries, the most reassuring numbers often arrive late, so viewing a company's moat and its cycle exposure separately can give a clearer picture of the risks involved.
See How the Signal 47 Multi-Factor Strategy Approaches This
The central lesson of this article is that a strong business and a well-timed exposure are two separate questions. A record backlog can answer the first while hiding the second.
The Signal 47 Multi-Factor strategy, available on the Surmount platform, is built around a similar separation. Rather than relying on a single headline metric, it screens 25 U.S. large-cap companies across four distinct factors and applies the same rules every time.
What the strategy is designed to do:
Quality screen: looks for resilient balance sheets and durable business models, the "moat" side of the question
Value screen: favors companies at attractive relative valuations with strong free cash flow, as a check against prices that already assume peak conditions
Momentum screen: looks for consistent price strength, a trend input that sits alongside reported fundamentals rather than depending on them
Dividend screen: includes established payers with stable or growing distributions
Sector spread: holds companies across technology, healthcare, financials, consumer staples, energy, and industrials, rather than concentrating in one industry's order cycle
Fixed discipline: equally weighted and rebalanced quarterly, so a record headline in any one quarter doesn't override the process
What it doesn't do:
It doesn't track backlog, order, or book-to-bill data directly
It holds equities, so it remains exposed to market declines and economic downturns
Quarterly rebalancing means changing conditions are reflected with a lag
Factor screens can lag the broader market for extended periods, and no systematic process removes risk
For readers who want the moat-versus-cycle distinction applied through consistent rules rather than case-by-case judgment, the strategy page lays out its full methodology, holdings approach, and risks.
Explore the Signal 47 Multi-Factor Strategy →
This content is for educational purposes only and is not investment advice. Strategy descriptions reflect design criteria, not past or expected results. All investing involves risk, including the possible loss of principal.
Frequently Asked Questions
What is a good book-to-bill ratio?
A reading above 1 means new orders are outpacing billings. The trend across several quarters usually says more than any single figure, especially late in a cycle.
How is book-to-bill calculated?
Divide the value of new orders booked in a period by the revenue billed in that same period. For example, $120 million in orders against $100 million billed gives 1.2.
Why is an order backlog a lagging indicator?
It reflects orders customers placed months or years earlier. That's why it can keep growing after new demand has slowed, as U.S. manufacturers' backlog did into late 2008.
Where is book-to-bill most commonly used?
Mostly in industries with long delivery times, such as aerospace, defense, semiconductor equipment, and project-based services, where orders take quarters or years to fill.
When do cyclical stocks tend to report record backlogs?
Often late in an expansion, when customer confidence and ordering are at their highest. The backlog can stay elevated for months even as new orders begin to slow.

Automate any portfolio using data-driven strategies made by top creators & professional investors. Turn any investment idea into an automated, testable, and sharable strategy.