How Long Do Bear Markets Last? A Historical Breakdown
Surmount Blogs
See how long bear markets last on average, based on decades of historical stock market data and recovery trends.

How Long Do Bear Markets Last? A Historical Breakdown
Watching a portfolio slide for weeks — or months — brings up one question fast: how long do bear markets last? The honest answer is that it depends on which bear market you're looking at, but decades of market history give us a reasonably clear range to work with.
What Is a Bear Market? (Bear Market vs. Correction)
Before digging into how long do bear markets last, it helps to define the term. A bear market is typically defined as a decline of 20% or more from a recent peak — a threshold used broadly across the index industry, including by S&P Dow Jones Indices, whose S&P 500 data underpins most bear market research. That's different from a bear market vs correction distinction — a correction is a smaller pullback, usually 10% to 20%, and tends to resolve much faster.
Corrections happen often and usually pass within weeks. Bear markets are rarer, deeper, and stick around longer — which is exactly why volatility itself isn't something to fear so much as understand — and why the question of how long do bear markets last matters so much to anyone with money in the market.
Quick definitions:
Pullback: a decline of roughly 5–10%
Correction: a decline of 10–20%
Bear market: a decline of 20% or more
How Long Do Bear Markets Last, On Average?
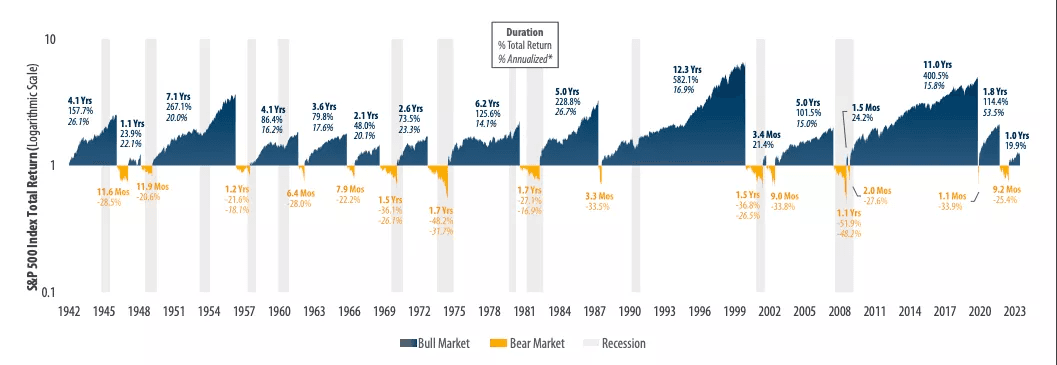
Based on S&P 500 data going back decades, the average bear market length is typically cited in the range of 9 to 13 months, though the exact figure varies by dataset and methodology. Average declines during these periods have historically landed in the 30–35% range.
That's the average — but averages hide a lot of variation. Some bear markets wrap up in a matter of weeks. Others drag on for close to two years. The point isn't that every downturn behaves the same way; it's that history gives us a baseline for what "normal" looks like, so a rough patch doesn't feel unprecedented.
How Often Do Bear Markets Happen?
If you're wondering how often do bear markets happen, Vanguard's own analysis of market history shows a bear market occurred roughly once every 5 to 6 years on average, with an average bear period duration of 1.1 years (compared to an average bull period duration of 5.1 years). Over a multi-decade investing timeline, that means most investors will live through a dozen or more bear markets. They're not rare, black-swan events — they're a recurring, structural feature of long-term investing.
The Longest Bear Market in History
The longest bear market in history for the S&P 500 stretched close to two and a half years, tied to the dot-com crash of the early 2000s. Morningstar's analysis of 150 years of U.S. stock market history shows that Depression-era declines in the 1930s were even longer. These extended downturns are the exception rather than the rule, but they're a useful reminder that "average" doesn't mean "guaranteed."
Bear Market Recovery Time: From Bottom to Breakeven
Duration and recovery are two different clocks. Bear market recovery time — the time it takes to climb back to the previous peak — often takes longer than the decline itself. Historical estimates for full recovery range anywhere from about 2 to 4.5 years, depending on the severity of the drawdown and which historical window is measured.
Not every recession lines up neatly with a stock market bear phase — the two can diverge in timing and severity, as the Federal Reserve's own recession data shows. That mismatch is part of why recovery timelines are so hard to predict in real time.
The gap between "market bottoms" and "portfolio breaks even" is where a lot of investor behavior goes sideways. It's also the stretch where emotional decision-making — panic-selling near the bottom, then hesitating to re-enter — tends to do more damage to long-term returns than the downturn itself.
How to Invest During a Bear Market
There's no single playbook for how to invest during a bear market, and anyone promising a guaranteed formula for timing the bottom should be treated with skepticism. The data on what actually happens when investors stay in the market during a downturn tells a more nuanced story than headlines suggest.
What the data does support is this: staying mechanically consistent — rather than reacting emotionally to each headline — has historically mattered more than trying to predict exactly when a downturn will end. CFA Institute research on investor behavior points to emotional decision-making during periods of uncertainty, not the downturn itself, as one of the biggest drags on long-term returns.
That's a harder discipline to maintain than it sounds. Watching a portfolio decline in real time triggers real stress, and stress is a poor advisor.
A Systematic Approach to Managing Drawdowns
This is where rules-based, automated strategies can play a role. The evidence on how automated approaches actually perform when markets turn suggests consistency matters more than most investors assume. Instead of relying on gut instinct to decide when to hold, trim, or rotate exposure, a systematic strategy applies the same logic every time — removing the emotional whiplash that tends to show up right when markets get volatile.
It doesn't answer how long do bear markets last with certainty; nobody can. But understanding how drawdown control works mechanically changes how an investor is positioned to handle the uncertainty in the meantime.
How Surmount's ROAR Score Moderate Strategy Handles This
Knowing that bear markets are a recurring, statistically predictable part of investing is one thing. Building a portfolio that doesn't rely on you correctly guessing when the next one starts — or ends — is another.
That's the exact problem the ROAR Score Moderate strategy on Surmount was built to address. Rather than asking an investor to decide, in real time and under stress, whether to hold, trim, or exit a position, ROAR Score Moderate applies a consistent, rules-based framework to that decision every single day.
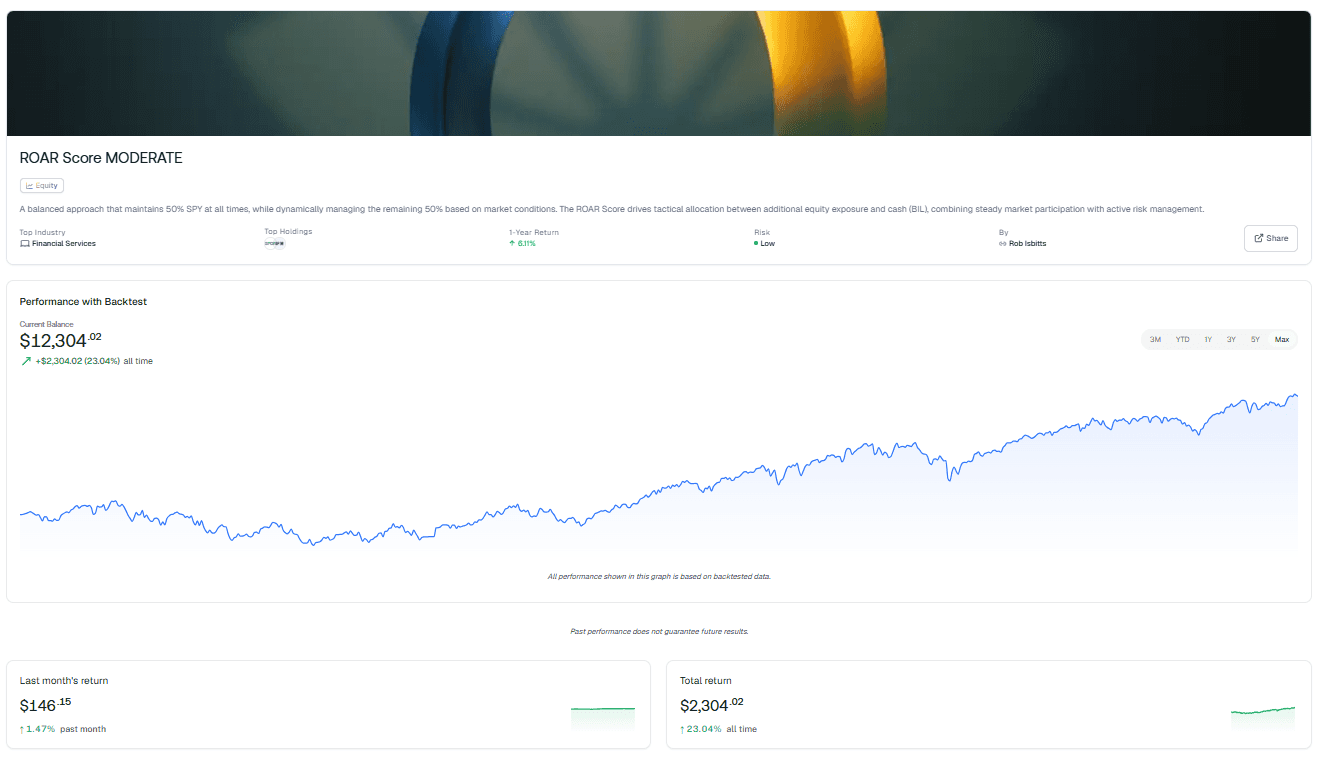
Here's what makes the approach worth exploring:
A steady core, always. The strategy maintains a baseline equity allocation at all times, so there's no all-or-nothing timing call to get right or wrong.
Dynamic risk response. The remaining portion of the portfolio shifts between additional equity exposure and cash based on real-time market conditions — adjusting automatically as conditions change, rather than waiting on a manual decision.
Removes emotional whiplash. Because the allocation logic runs the same way every time, it isn't subject to the panic-selling or hesitant re-entry patterns that historically cost long-term investors real returns during downturns.
Built for the exact uncertainty this data describes. The historical record shows bear markets are frequent and recoveries take time — ROAR Score Moderate is designed to keep an investor systematically positioned through that uncertainty, rather than reacting to it after the fact.
Curious how this plays out in practice? You can see the ROAR Score Moderate strategy in action on Surmount, including its historical backtesting data, to explore whether this kind of systematic, rules-based approach fits how you think about risk.
This content is for educational purposes only and should not be construed as investment advice or a recommendation to buy or sell any security. All investing involves risk, including possible loss of principal. Past performance does not guarantee future results.
Frequently Asked Questions
How long do bear markets last on average?
Historically, the average bear market length has run between roughly 9 and 13 months, though individual downturns vary significantly in duration and severity.
What's the difference between a bear market and a correction?
A correction is a decline of 10–20% from a recent peak, while a bear market is a steeper drop of 20% or more — the key distinction in the bear market vs correction comparison.
How often do bear markets happen?
Based on historical S&P 500 data, bear markets occur roughly once every 3.5 to 5 years, making them a regular, recurring part of long-term investing rather than a rare event.
What was the longest bear market in history?
The longest bear market in history for the S&P 500 lasted close to two and a half years, tied to the early-2000s dot-com crash, though some Depression-era downturns stretched even longer.
How long does bear market recovery typically take?
Bear market recovery time — the span between a market bottom and reaching a new high — has historically averaged between roughly 2 and 4.5 years, depending on the severity of the decline.

Automate any portfolio using data-driven strategies made by top creators & professional investors. Turn any investment idea into an automated, testable, and sharable strategy.