Why Volatility Is a Feature, Not a Bug, for Long-Term Investors
Surmount Blogs
Market swings feel painful, but they create opportunity. Discover how corrections reset valuations, improve future return potential, and reward disciplined investors.

Waking up to see your portfolio dropping 10% feels like a physical blow. Your stomach knots, you start calculating how many months of salary just "vanished," and the instinct to do something—anything to stop the bleeding—becomes overwhelming.
This fear is becoming ever more palpable, given how volatile the market has been in recent months following geopolitical shocks, tariff uncertainties, and the idea that the AI bubble will deflate.
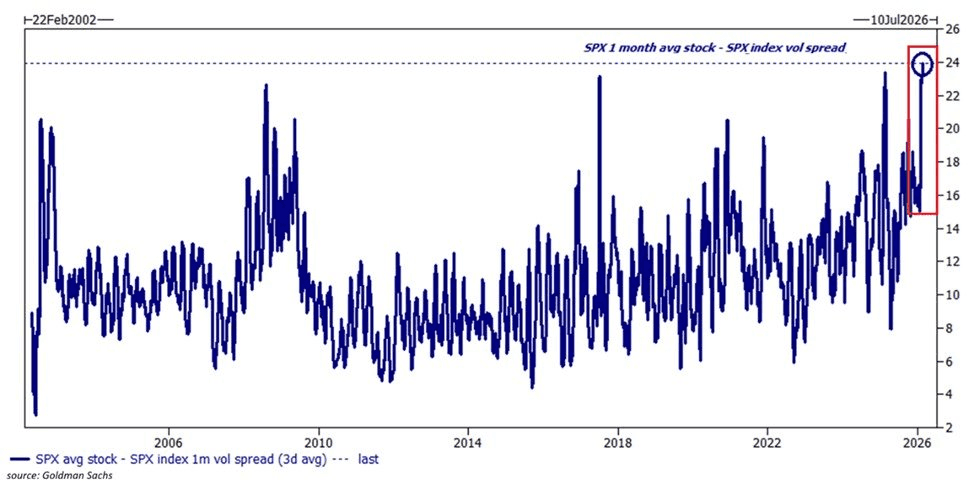
Data from Goldman Sachs actually points out that the 1-month realized volatility of the average S&P 500 stock relative to the index itself has climbed to 24 points—the highest on record. This tells us that while the "S&P 500" as a single entity seems stable, the individual companies inside it are swinging wildly.
To put this in perspective, this divergence is currently higher than it was during the 2008 Financial Crisis. In 2008, everything broke at once; today, the index is being held together by a thin veneer of stability while individual sectors are being shredded and rebuilt.
Understandably, these conditions would put off even the most seasoned investors, as the market" feels more and more like a minefield.
However, many tend to overlook the fact that volatility is a mechanism that has a very specific purpose. Without these stomach-churning swings, there would be no "equity risk premium"—the extra profit you earn for choosing stocks over a "safe" savings account.
In fact, if the market moved in a perfectly predictable upward line, everyone would pile in until the price reached its maximum theoretical value. The "bargains" that fuel long-term wealth creation simply wouldn't exist.
Think of volatility not as a bug in the code, but as the admission fee for high-performing assets. If stocks only moved up in a predictable 8% line every year, they would be as "safe" as savings accounts—and their returns would eventually dwindle to match. We are paid a premium precisely because we are willing to endure the uncertainty.
The "Healthy Reset": How Corrections Fix Valuations
In the heat of a market slide, it is easy to view falling prices as a destruction of value. However, from a structural perspective, a correction is often the very mechanism that preserves the long-term viability of an uptrend. To understand why, one must look at the relationship between price and fundamentals.
During extended bull markets, prices frequently rise faster than the underlying earnings of the companies they represent.
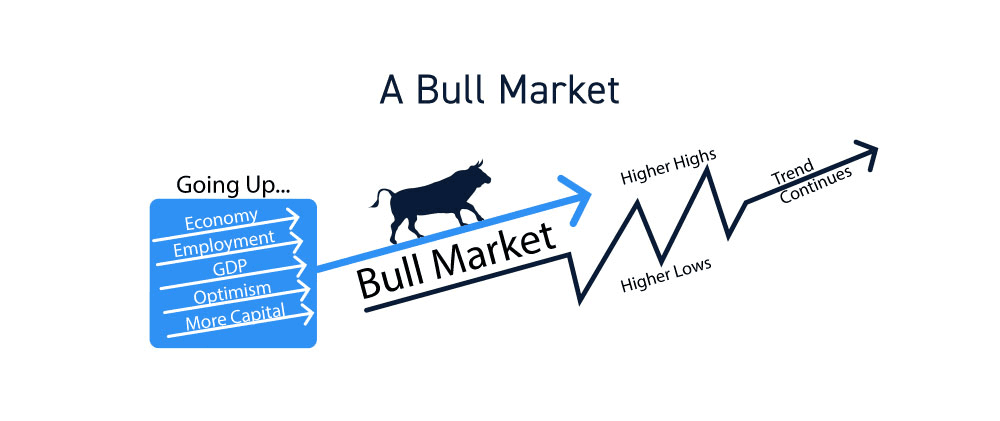
This phenomenon, known as multiple expansion, leads to "frothy" valuations where investors are paying a significant premium for every dollar of profit. When the gap between a stock’s price and its intrinsic value becomes too wide, the market becomes fragile—vulnerable to even the slightest negative headline regarding tariffs, geopolitical shifts, or interest rate tweaks.
When this goes on beyond check, and begins to excessively become defined by investor greed, market corrections acts as a financial pressure valve. It performs three critical functions that "fix" the market’s internal health:
Flushing Out Speculative Excess:
Corrections tend to eliminate "weak hands"—short-term speculators who entered the market based on momentum rather than value. Their exit stabilizes the investor base.
Mean Reversion:
Prices are pulled back toward their historical averages (such as the 200-day moving average). This prevents a "melt-up" scenario, which almost always ends in a far more catastrophic crash.
Improving Forward Returns:
Mathematically, the lower the price you pay today for a stream of future cash flows, the higher your expected long-term return. By resetting valuations to more reasonable levels, a correction actually mathematically increases the future profit potential for those who deploy capital during the dip.
Without these periodic resets, the market would eventually reach a point of "valuation exhaustion," where no new buyers are willing to enter at such inflated levels. By "resetting the clock," a 10% or 15% drawdown allows corporate earnings to catch up with stock prices.
For the disciplined investor, this transition from optimism back to realism is not a sign of failure; it is the market clearing the brush to make room for the next phase of sustainable growth.
The Math of the Bounce: Compounding After a Pullback
To the untrained eye, a market crash looks like a hole in your savings. To the seasoned investor, it looks like a coiled spring. Understanding the "Math of the Bounce" is the difference between panic-selling at the bottom and wealth-building for a lifetime.
There is a mathematical quirk in investing: losses and gains are not symmetrical. If a stock drops 20%, it doesn't just need a 20% gain to get back to where it started—it needs 25%.
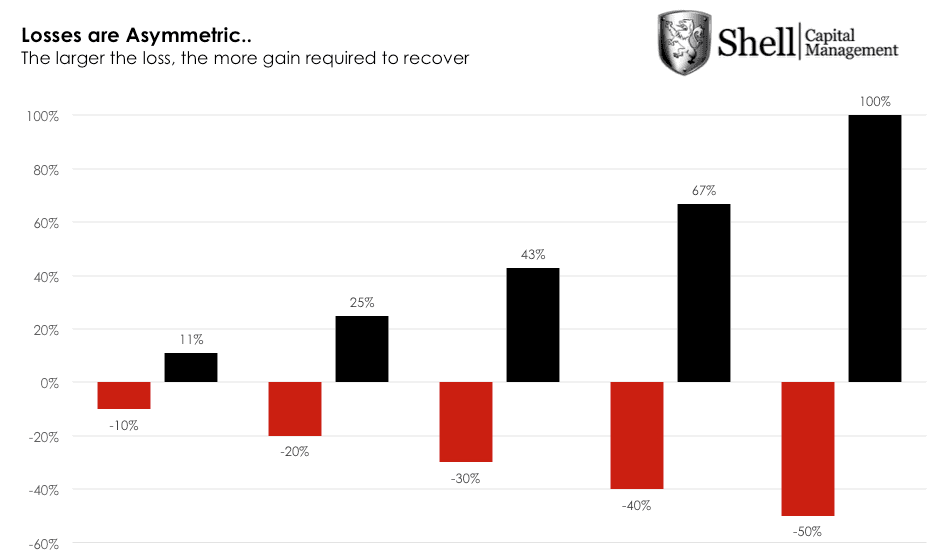
This is precisely why it is so critical to keep your capital in the game. When that 25% "recovery bounce" happens, it doesn't just repair the damage for the person who stayed invested; it acts as a launchpad for the person who kept buying.
To understand why volatility is a "feature," you have to look at how compounding resets after a dip. Let's look at the math of three different investors during a hypothetical 20% market correction:
Scenario | Starting Value | The Drop (20%) | The Recovery (25%) | Final Value |
Investor A (The Quitter) | $10,000 | $8,000 (Sells to "Wait and See") | Misses the bounce | $8,000 |
Investor B (The Holder) | $10,000 | $8,000 (Stays Invested) | $10,000 (Back to Even) | $10,000 |
Investor C (The Accumulator) | $10,000 | $8,000 (+ Adds $2,000 at bottom) | $10,000 + $2,500 | $12,500 |
For Investor C, the volatility wasn't a risk—it was a discount. By holding or adding during the "red" days, you aren't just waiting for a return to normalcy; you are positioning your capital to capture a 25% gain on every dollar deployed at the bottom. That is how the "heavy lifting" of wealth creation occurs.
It’s useful to think of the market like a coiled spring. A drawdown builds up potential energy. When the "macro" news shifts—perhaps a cooling inflation report or a resolution to a geopolitical conflict—that energy is released. Because markets are forward-looking, they don't wait for the world to be "perfect" before they rally; they rally as soon as things look slightly less bad than they did yesterday.
Why Disciplined Investors Actually Win
As Warren Buffett famously noted, the stock market is a device for transferring money from the impatient to the patient. When volatility spikes, "weak hands"—investors who haven't defined their risk tolerance or are investing money they need next month—scramble for the exit.
By selling during a 10% or 15% drawdown, these investors lock in a permanent loss of capital. Meanwhile, the disciplined investor stays put or, better yet, continues to buy if the fundamentals actually allow for it. They aren't "smarter" in a mathematical sense; they are simply more emotionally resilient. They recognize that a lower price for the same high-quality company is a sale, not a scare.
One investment strategy that is almost perfectly designed to exploit the dynamics of volatility we’ve discussed is Surmount’s Signal 47 Multi-Factor ETF strategy:
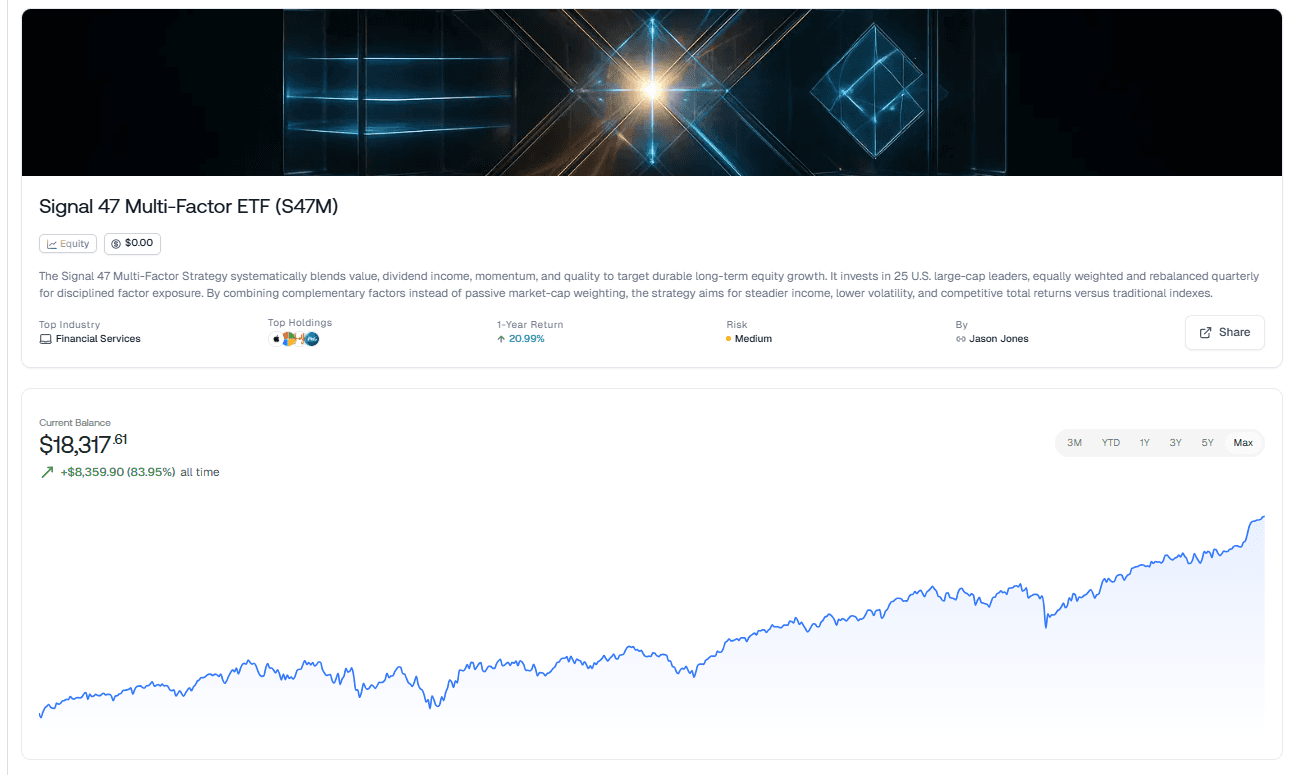
While a standard S&P 500 index fund is market-cap weighted (meaning you own more of a stock just because it’s expensive), this rules-based approach uses volatility as a rebalancing tool.
Here is how the S47M strategy works phenomenally given the volatility framework we’ve laid out:
Systematic "Buy Low, Sell High" via Equal Weighting
Because the fund is equally weighted and rebalanced quarterly, it mathematically forces the "transfer of wealth" we mentioned.
When a high-momentum tech stock surges and becomes 6% of the portfolio, the quarterly rebalance forces the fund to sell that "froth."
It then redistributes those gains into the stocks that have dipped (the "value" or "quality" factors).
The Result: You are systematically buying the "feature" (the dip) and trimming the "bug" (the overextension).
The "Quality" and "Value" Buffer
In this piece, we noted that corrections "reset valuations." By screening for Free Cash Flow and Value, this ETF ensures you aren't holding the "hollow" companies that get wiped out during a 10% drawdown.
Quality/Resilient Balance Sheets: These act as the floor during a panic. When the market knots your stomach, knowing your ETF holds companies with durable business models helps you stay disciplined.
Dividend Strength: These distributions provide a "return of capital" regardless of price action. In a flat or volatile market, dividends are often the only positive contributor to total return.
Factor Diversification (The Anti-Correlation Play)
The beauty of blending Momentum with Value and Dividends is that these factors rarely crash at the same time.
Momentum wins during the "Optimism" phase of the cycle.
Value and Dividends usually protect you during the "Despair" or "Correction" phase.
By combining them, the Signal 47 strategy aims to smooth out the "physical blow" of a 10% drop, making it emotionally easier for you to remain a "patient" investor.
Benchmarking Against the "Laggards"
By benchmarking against VTV (Value) and MTUM (Momentum), the fund acknowledges that one factor will always be "out of favor." The strategy works because it doesn't try to guess which one will win next; it simply stays exposed to all of them, ensuring that when the "Spring Effect" happens, the portfolio is positioned to capture it from multiple angles.

Automate any portfolio using data-driven strategies made by top creators & professional investors. Turn any investment idea into an automated, testable, and sharable strategy.


