Education
Is the Semiconductor Bubble About to Burst?
The AI revolution has minted a new class of market darling: the semiconductor stock. Chipmakers have surged, ETFs tracking the sector have attracted billions, and valuations have climbed to levels not seen since the dot-com era. But beneath the excitement, a set of hard-to-ignore warning signs is building. Here's what the data actually says about the semiconductor bubble — and what investors should be doing about it.
What's Driving the Semiconductor Bubble?
The AI Narrative and Reflexive Price Action
The current semiconductor rally is powered by a simple but self-reinforcing story: AI needs chips, chips are scarce, therefore chip companies are worth more. As prices rise, they validate the narrative, pulling in more capital, which pushes prices higher still.
This is textbook market reflexivity — a feedback loop where belief and price action reinforce each other until the loop breaks. The market stops pricing in realistic earnings and starts pricing in a perfect, frictionless future.
The AI rally has been further stoked by hyperscalers committing hundreds of billions to infrastructure — but as our breakdown of big tech CapEx cycles shows, peak spending phases have historically preceded — not accompanied — the best returns. And the hallmarks of the current AI bubble look uncomfortably familiar to prior speculative cycles. That's when things get dangerous.
Why Cyclical Stocks Peak When They Look the Best
Semiconductors are not a growth industry in the traditional sense — they are a deeply cyclical one. According to McKinsey Global Institute research on semiconductor industry cycles, the pattern repeats across every decade:
Demand rises → manufacturers expand capacity
Capacity catches up → oversupply sets in
Prices compress → margins collapse
Investment slows → the cycle resets
Legendary investor Peter Lynch identified this trap clearly: the worst time to buy cyclicals is when they look the best. Right now, semiconductor stocks look very good indeed.
What the Data Says About Tech Stock Overvaluation
The numbers behind the semiconductor bubble are striking. This isn't a matter of sentiment alone — multiple independent valuation frameworks are flashing the same warning. Stretched valuations become even more precarious when rates remain elevated — a dynamic we've explored in depth for tech stocks specifically.
The Buffett Indicator and Semiconductor Concentration
Semiconductors now represent 18.8% of the S&P 500 — an all-time high, according to S&P Global sector weight data.
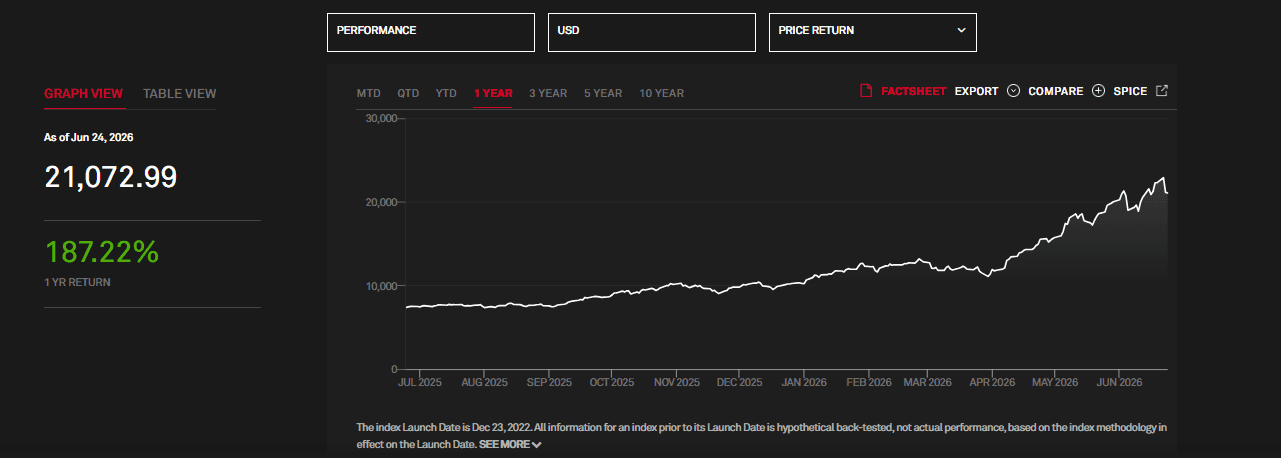
The Buffett Indicator, which compares total market capitalization to GDP — tracked publicly via FRED — shows semiconductor valuations running well ahead of the underlying economy.
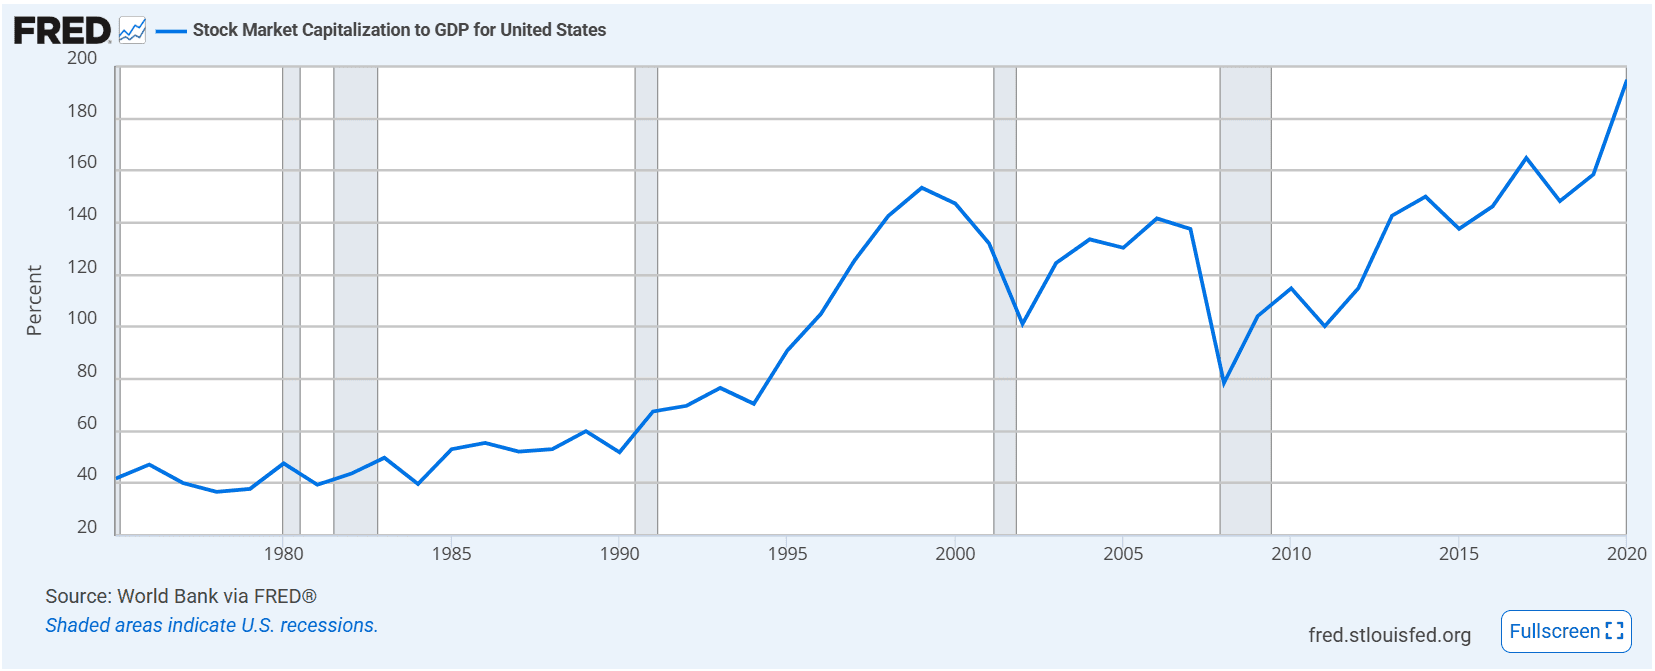
When a single sector accounts for nearly one-fifth of the entire index, concentration risk becomes a portfolio-level problem, not just a sector one.
Shiller CAPE Ratio at Dot-Com Levels
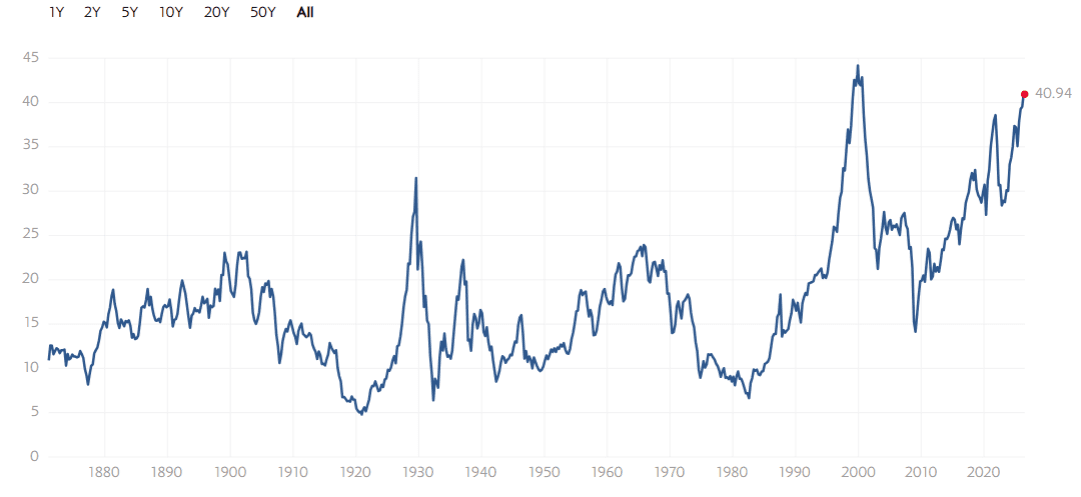
The Shiller CAPE ratio — which smooths earnings over a 10-year cycle to remove short-term distortions — has reached levels not seen since the dot-com peak. For a sector as earnings-volatile as semiconductors, this is particularly alarming. Current prices are being justified by peak earnings assumptions, which history tells us never hold indefinitely.
Margin Debt Risk and the Leverage Problem
Perhaps the most underappreciated warning sign is the level of margin debt in the system. FINRA margin debt statistics show elevated margin debt as a percentage of GDP, meaning a significant portion of the current rally has been funded by borrowed money.
This cuts both ways:
In rising markets: leverage amplifies gains
In falling markets: it forces rapid selling, accelerating losses
When sentiment shifts in a leveraged market, the unwind is rarely orderly.
What Happens When Semiconductor Stocks Crash?
How Fast Cyclical Downturns Hit
Cyclical sector corrections are not gradual. When the narrative breaks, the same forces that drove prices up — momentum, leverage, and liquidity — reverse direction simultaneously. Understanding how to navigate that volatility systematically is what separates reactive investors from prepared ones.
Investors in semiconductor ETFs who believe they are riding a long-term secular trend may find themselves caught in what is actually a late-stage reflexive rally. History is consistent on this point: the transition from peak enthusiasm to contraction in cyclical industries is abrupt and unforgiving. The AI story may be real. The current price of that story almost certainly isn't.
How to Position Before the Sector Rotation Begins
Waiting for confirmation that the semiconductor bubble has burst is a costly strategy. By the time the correction is obvious, the damage is done. Investors who manage this risk systematically — rotating out of overexposed sectors and into assets with different risk profiles — tend to navigate these transitions far better than those reacting to headlines.
For investors weighing where to rotate capital, a direct comparison of tech and energy sector dynamics offers a useful framework. A rules-based sector rotation strategy — one that shifts allocations based on momentum and relative strength rather than gut feel — is precisely the kind of systematic tool built for this environment.
How to Play This With a Systematic Strategy
The semiconductor bubble isn't a reason to panic — it's a reason to have a plan.
Investors who navigate cyclical downturns best aren't the ones who react fastest. They're the ones who already have a rules-based system doing the heavy lifting before the correction arrives. That's exactly what Surmount's GLD-Tech Rotation strategy is built for.
Here's why it fits this moment:
It doesn't pick sides permanently. Rather than holding tech through every phase of the cycle, GLD-Tech Rotation dynamically shifts between high-growth tech exposure (TQQQ) and gold (GLD) based on which is outperforming — so your capital is always leaning toward the stronger asset
It responds to momentum, not emotion. The strategy rebalances daily based on recent relative performance, removing the guesswork and gut-feel decisions that cost investors the most during volatile rotations
It has a built-in circuit breaker. When prices move more than 1.5 standard deviations from the 20-day moving average — exactly the kind of extreme volatility that accompanies a bubble bursting — the strategy reduces capital deployment to just 50%, automatically limiting downside exposure
It's designed for the environment this post describes. A market where tech is overextended and gold stands as a credible alternative is precisely the regime GLD-Tech Rotation was built to navigate
When the semiconductor bubble deflates, passive tech holders will feel the full force of the unwind. Systematic rotators won't.

Deploy the GLD-Tech Rotation strategy on Surmount today — and let the algorithm do what emotions can't.
Frequently Asked Questions
Is the semiconductor bubble real or just market speculation?
The semiconductor bubble is supported by multiple valuation frameworks — including the Shiller CAPE ratio at dot-com levels and semiconductors hitting an all-time high of 18.8% of the S&P 500. These aren't sentiment indicators; they're hard data points signaling genuine overextension.
What causes a semiconductor bubble to burst?
Semiconductor bubbles typically burst when the cyclical reality of oversupply catches up with inflated demand expectations, compressing margins and triggering a rapid unwind of leveraged positions across the sector.
How does the Buffett Indicator relate to tech stock overvaluation?
The Buffett Indicator compares total market cap to GDP — and when semiconductor valuations drive that ratio to historic highs, it signals that asset prices have detached from the underlying economy, a classic warning sign of tech stock overvaluation.
What is a sector rotation strategy and why does it matter now?
A sector rotation strategy systematically shifts capital between sectors based on relative performance — moving away from overextended areas like semiconductors and into defensive or alternative assets before a downturn fully materializes.
How can I protect my portfolio from a semiconductor stocks crash?
Rather than trying to time the crash manually, a rules-based strategy that dynamically rotates between growth and defensive assets — responding to momentum signals and volatility triggers — is the most reliable way to manage semiconductor stocks crash risk systematically.
Automate any portfolio using data-driven strategies made by top creators & professional investors. Turn any investment idea into an automated, testable, and sharable strategy.