The Dividend Investing Safety Checklist Smart Investors Use
Surmount Blogs
Stop chasing dangerous "yield traps." Learn how to use a rigorous 4-step dividend safety checklist to identify sustainable payouts, protect your capital, and invest with confidence.

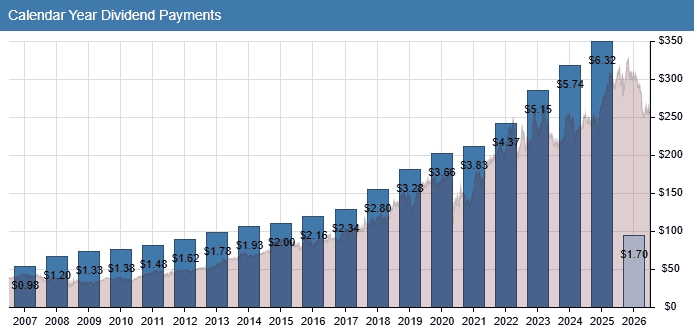
While the S&P 500 is known to historically outperform the ProShares S&P 500 Dividend Aristocrat ETF (NOBL), 2026 is proving to be quite different:
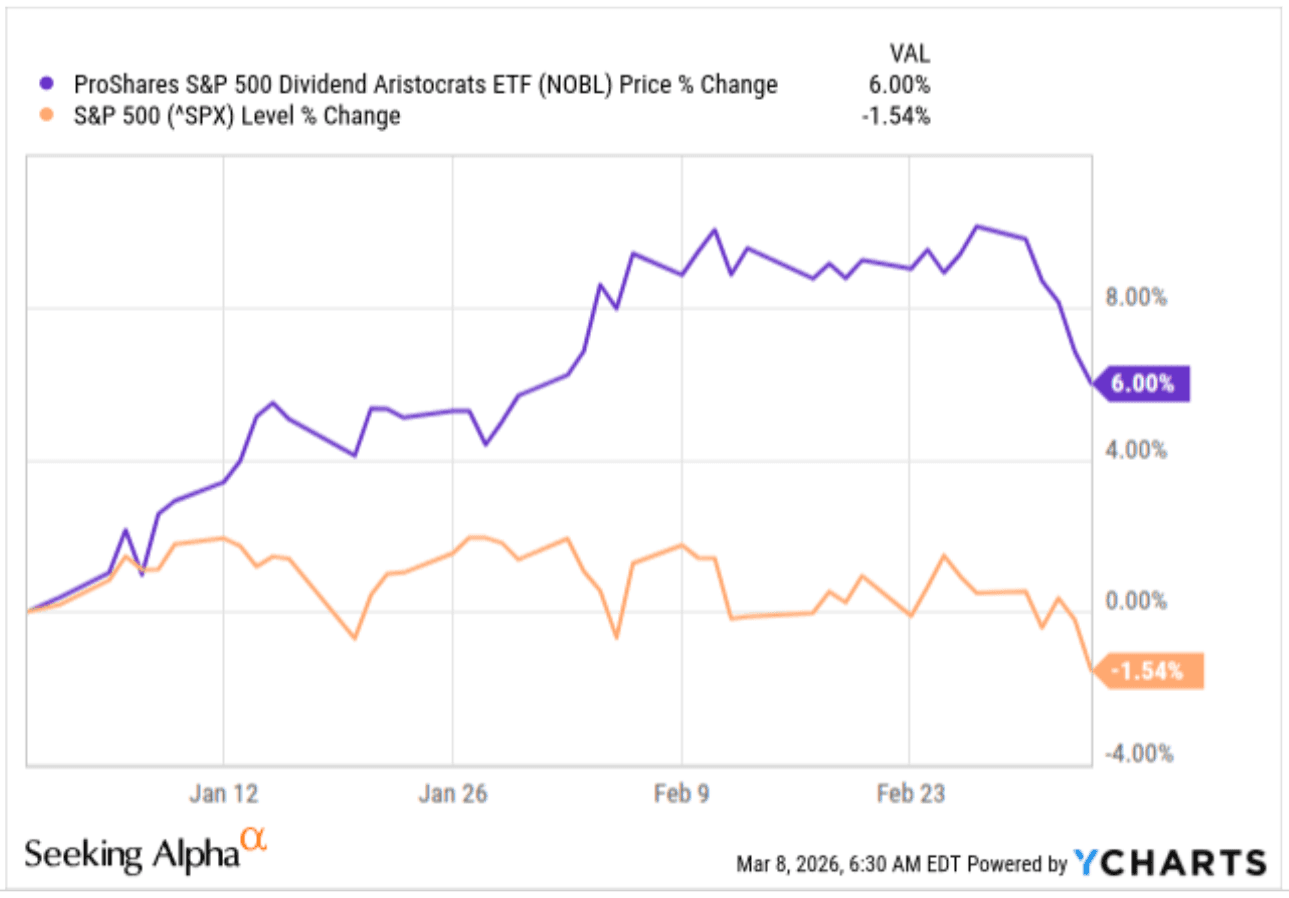
This seems to come primarily from a fundamental shift in market regime, as the "growth-at-any-price" era of the early 2020s recedes into the rearview mirror. With the heightened volatility (coming from tariff fears, war fears, and AI bubble fears) currently whipsawing portfolios, investors are increasingly pivoting away from speculative capital gains and back toward the fundamental security of cold, hard cash distributions through dividend investing.
In this environment, the yield is no longer just a bonus; it’s an insurance policy. However, this shift has created a dangerous trap: thousands of investors are rushing into dividend-paying stocks without performing the necessary surgery to see if those payouts are built on solid ground or shifting sand.
The market is currently littered with "Yield Traps"—companies paying out unsustainable dividends to mask deteriorating balance sheets or shrinking margins. Chasing a double-digit yield is easy; keeping your capital intact while collecting it is where the skill lies.
To survive the current volatility, you need to stop acting like a passive income seeker and start thinking like a defensive capital allocator. That starts with a rigorous, repeatable process.
In this blog, we present a technical checklist designed to peel back the curtain of corporate accounting and reveal whether a company’s dividend is sustainable—or a ticking time bomb. Let’s break down the metrics the pros use to separate the Dividend Aristocrats from the dividend traps.
Step 1: Payout Ratio Analysis (Dividend Investing’s "Breathing Room" Test)
The payout ratio is the most fundamental diagnostic tool for any dividend investor. It tells you exactly how much of a company’s profit is being sent to shareholders versus how much is being reinvested into the business to fuel future growth.
The formula is straightforward. You simply divide the total amount paid out in dividends by the total net income earned during a period of time:
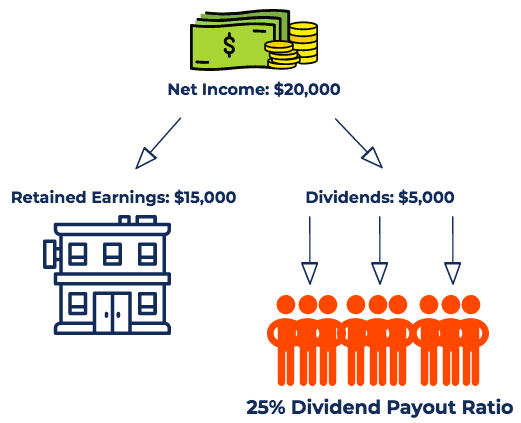
Essentially, if a company earns $20,000 in earnings and pays out $5,000 in dividends, it has a 25% payout ratio. This means for every dollar of profit, 25 cents goes to your pocket, and 75 cents stays in the company’s treasury.
Reading the "Temperature" of the Dividend
Think of the payout ratio as a measure of "breathing room." The lower the percentage, the more room the company has to maneuver during economic downturns without sacrificing your income.
0% – 40% (The Growth Zone): The company is conservative. It has plenty of capital to reinvest in R&D, acquisitions, or debt reduction. These dividends are typically the safest and have the most room to grow.
40% – 60% (The Balanced Zone): This is the "sweet spot" for many mature blue-chip companies. It’s a sustainable level that balances rewarding shareholders with maintaining a healthy balance sheet.
60% – 90% (The Caution Zone): The company is paying out the vast majority of its profits. Any slip in earnings—due to a recession or supply chain issue—could put the dividend at risk.
100%+ (The Danger Zone): If the ratio exceeds 100%, the company is paying out more than it earns. This is unsustainable. Management must either cut the dividend or tap into cash reserves/debt to keep the payments going.
Important Nuance: Sector-Specific Rules
Do not blindly apply the "under 60%" rule to every industry. Some sectors have business models that naturally result in higher payout ratios.
For instance, REITs (Real Estate Investment Trusts), are a clear exception. They must distribute at least 90% of their taxable income to shareholders to maintain their tax status, their payout ratios will often look high. For these, use Funds From Operations (FFO) or Adjusted Funds From Operations (AFFO) instead of standard Earnings Per Share.
Similarly, utilities are capital-intensive but stable. They often carry higher payout ratios (60%–80%) because their earnings are highly predictable and regulated.
Pro-Tip: It could be useful to look at the trend. A company moving from a 40% payout to a 75% payout over five years isn't just rewarding shareholders—it’s slowly suffocating its own future growth.
Step 2: Free Cash Flow Coverage (The Reality Check)
If the Payout Ratio is the "speedometer" of a company’s dividend, Free Cash Flow (FCF) is the engine underneath the hood.
Investors often make the mistake of looking only at Net Income. However, Net Income is an accounting figure that can be inflated by non-cash items. Cash is the only thing a company can actually use to pay dividends.
To determine if the dividend is truly safe, we must look at how much cash remains after the company has paid for its essential operations and capital expenditures (CapEx).
To arrive at the free cash flow figure, you would need to start with the net income, add back non-cash expenses (such as depreciation or amortization), and subtract working capital increases and capital expenditure.
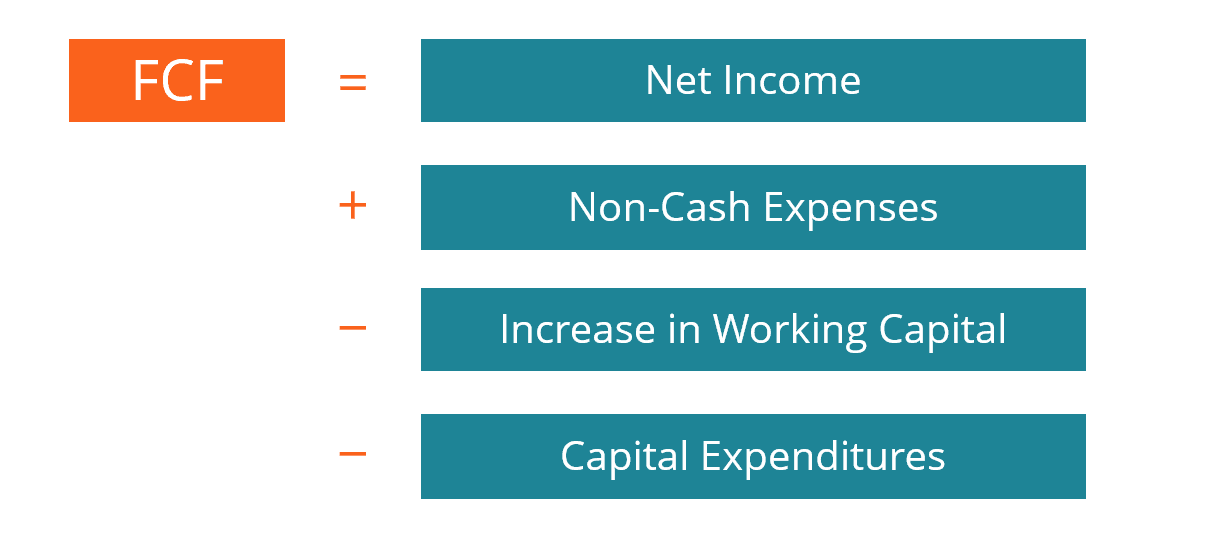
After determining free cash flow, you simply dividend payments by this figure, and you will have your cash dividend payout ratio in percentage terms.
How to Interpret the Result
Below 50%: Excellent. The company has a significant "margin of safety." They can easily pay the dividend, fund new growth projects, and still have cash left over for buybacks or debt repayment.
50%–75%: Healthy. The company is generating enough cash to sustain the payout comfortably while balancing reinvestment needs.
Above 90%: Caution Zone. The company is paying out almost everything it brings in. If they hit a rough patch or unexpected expenses arise, the dividend is at immediate risk of a cut.
Over 100%: The Danger Zone. If the payout exceeds 100% of FCF, the company is borrowing money or draining its cash reserves to pay shareholders. This is not a dividend; it is a ticking time bomb.
The "Hidden" Traps
When calculating this, keep two things in mind:
Number one is consistency. Does the company generate positive FCF every year, or does it rely on one-off asset sales? You want to see a reliable trend, not a lucky spike.
Number two is CapEx Cycles. Some companies, like utilities or telecom providers, have massive infrastructure needs. If a company is in the middle of an "investment super-cycle," their FCF might be temporarily low. Ensure you aren't penalizing a company for investing in its own future growth.
Step 3: Balance Sheet Strength & Credit Ratings (The "Margin of Safety")
With dividend investing, it’s important to keep in mind that even if a company has stellar earnings, a bloated balance sheet can be a ticking time bomb for dividend sustainability. When economic storms hit, companies with high debt levels prioritize interest payments to lenders over dividend payments to shareholders. To ensure the dividend is safe, you must treat the balance sheet as the company’s "fortress."
Towards this end, there are three core areas to keep watch of:
1. The Debt-to-EBITDA Ratio
The most common metric for gauging solvency is the Debt-to-EBITDA ratio. This tells you how many years it would take for the company to pay off its debt using its current level of operational cash flow.
The sweet spot is generally, a ratio of 2.0x or below, which is considered healthy for most industries.
Once you creep above 3.5x to 4.0x, the company has little room for error. If revenue drops, debt service costs will quickly consume the cash that should have gone to your dividend.
2. The "Credit Shield"
You don’t have to be a forensic accountant to judge a company’s creditworthiness; credit rating agencies (like S&P, Moody’s, and Fitch) have already done the heavy lifting.
Investment grade companies (with BBB- / Baa3 or higher) have reliable access to capital markets. They can borrow money at reasonable rates to weather downturns without needing to slash the dividend.
Alternatively the speculative/junk category (BB+ / Ba1 or lower) come with far greater risk. Companies in this territory face higher interest expenses. If they need to refinance debt during a period of high interest rates, the dividend is often the first thing on the chopping block to preserve liquidity.
As a rule of thumb, if a company’s credit rating is downgraded, start your due diligence over. A downgrade is a signal that the "smart money" (lenders) sees an increased risk of default—you should listen.
3. The "Interest Coverage" Ratio
Beyond the total debt, you need to know if the company can afford the interest on that debt. A simple way to check this is the interest coverage ratio:
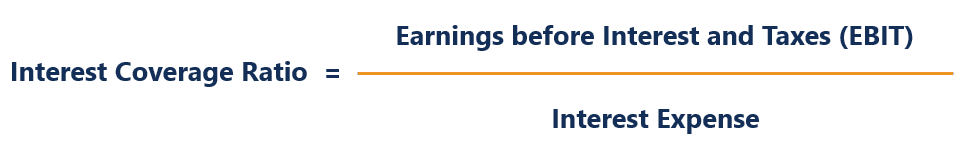
A healthy ratio is usually above 3.0x. If the company is paying out nearly as much in interest as it earns in profit, the "safety" of your dividend is an illusion.
Step 4: Earnings Growth & Historical Trends
A dividend payment is a promise, but it is not a legal obligation until it is declared by the Board of Directors. When earnings growth turns negative, that promise becomes a burden on the balance sheet. In this step, we evaluate whether the company is growing its ability to pay or merely depleting its resources.
There are a few ways for investors to do this:
1. Checking Earnings Per Share (EPS)
The most common mistake investors make is looking at the dividend in a vacuum. You must overlay the Dividend Payout with the company’s EPS over the last 3–5 years.
Ideally, you want to see a "staircase" pattern—where both EPS and the Dividend are trending upward in parallel.
However, if the dividend is rising while EPS is flat or declining, the company is increasing its payout ratio to keep shareholders happy, even as the business weakens. This is the classic "Dividend Trap" setup, and is usually seen as a major red flag.
2. Dividend Growth Streak
Consistency is a proxy for corporate discipline. Look for companies that have a history of annual dividend increases.
A company that has increased its dividend for 10, 20, or 25+ years has essentially built "dividend maintenance" into its corporate culture. During an economic downturn, management will fight to keep that streak alive, which can act as a powerful signal of confidence in their own cash flow stability.
3. The Payout Ratio Compression
Sometimes a company’s earnings grow faster than its dividend. This actually improves the safety of the dividend.
If a company keeps its dividend payout stable while growing its EPS, the payout ratio naturally drops. This gives the company more "breathing room" to survive a bad quarter or invest in new growth initiatives without cutting the dividend.
Take the Guesswork Out of Dividend Growth
You now have the Dividend Safety Checklist—a powerful framework for protecting your capital and building a resilient income stream. But let’s be honest: manually running every stock through these five metrics takes time that most investors don't have.
Why do the heavy lifting yourself when you can stand on the shoulders of giants?
We’ve built the T. Rowe Dividend Growth Tracker to do the work for you. We take the high-conviction holdings of institutional-grade dividend growth funds and run them through our proprietary safety framework in real-time.
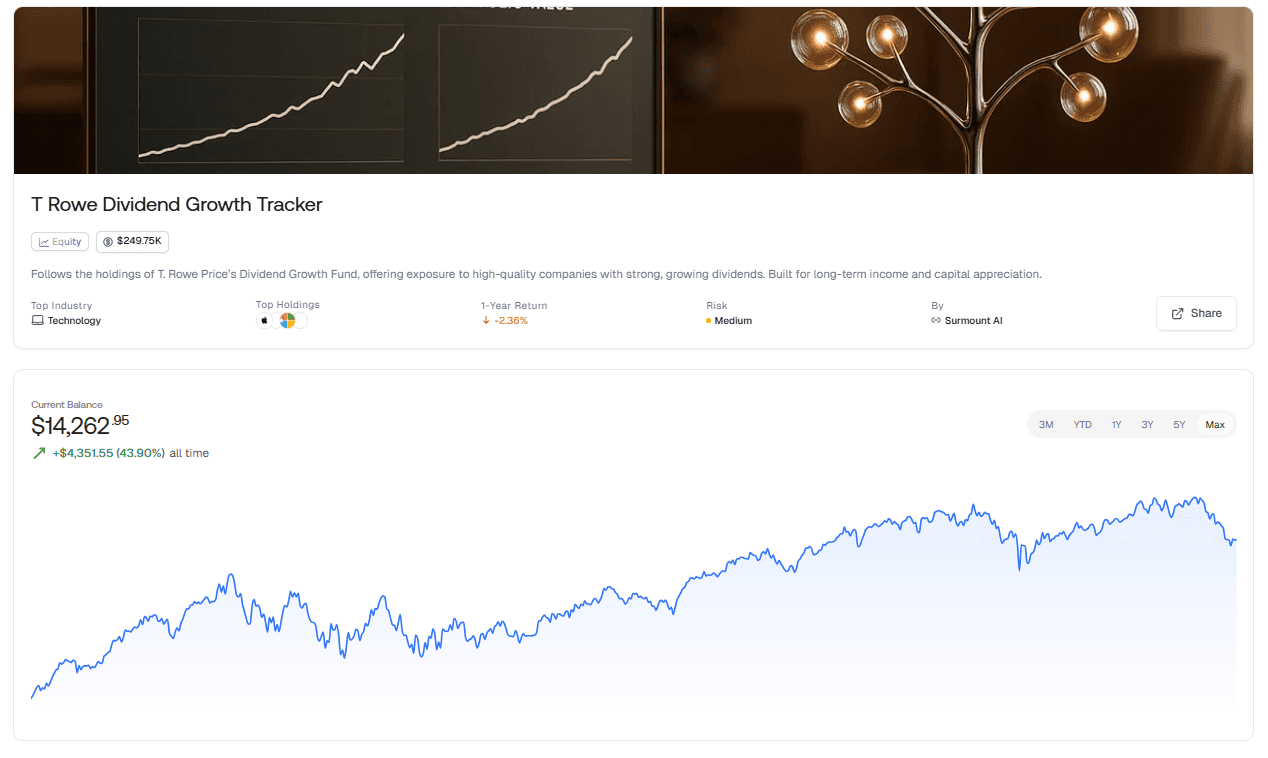
Instant Visibility: See which top-tier companies pass our 5-point safety check today.
Curated Quality: Stop wasting time on "yield traps" and focus only on proven dividend growers.
Actionable Intelligence: Get the data you need to make informed, defensive decisions without spending hours in spreadsheets.
Ready to upgrade your due diligence process?

Automate any portfolio using data-driven strategies made by top creators & professional investors. Turn any investment idea into an automated, testable, and sharable strategy.


