Mean Reversion Trading Strategy: The Complete Guide
Surmount Blogs
Mean Reversion Trading Strategy: Learn how it works, key indicators, and see a live AAPL/GOOG arbitrage strategy you can deploy today. Start trading smarter.

Mean Reversion Trading Strategy: The Complete Guide
Most explainer posts on the mean reversion trading strategy give you the theory and leave you stranded. This one goes further. Below, you'll learn exactly what mean reversion is, how traders operationalize it with real indicators, where it works (and where it breaks down), and — at the bottom — you'll find a live, deployable arbitrage strategy on Surmount that puts every concept on this page into real-world action.
What Is Mean Reversion? (The Core Idea)
Mean reversion is the observation — and the bet — that asset prices tend to drift back toward their long-run historical average after an extreme move in either direction. The core assumption: markets overreact. Fear and greed push prices further than fundamentals justify, and once the dust settles, prices normalize.
This isn't a fringe theory. It's backed by decades of academic research in behavioral finance, including work by De Bondt and Thaler in the 1980s showing that the worst-performing stocks over a three-to-five year period consistently outperformed over the next horizon — and vice versa. The why is partly mechanical (stop-loss cascades, forced liquidation) and partly psychological (loss aversion, recency bias).
Core Definition
Mean reversion in trading is the strategy of buying an asset that has fallen significantly below its historical average — or selling one that has risen far above it — in expectation that price will return toward the mean.
In practice, "the mean" can mean many things: a 20-day moving average, a statistically-derived fair value, the midpoint of a Bollinger Band, or the historical spread between two correlated assets. The choice of mean is as important as the strategy itself.
How the Mean Reversion Trading Strategy Works (Step by Step)
Step 1 — Define Your Mean
You cannot trade mean reversion without first deciding what "normal" looks like. Common choices include:
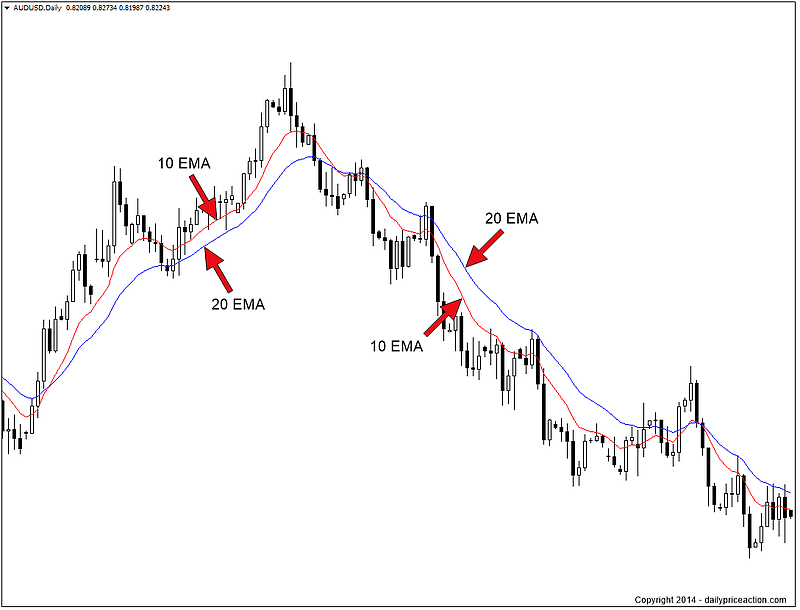
Simple Moving Average (SMA) — A rolling average over N days. The 20-day SMA is the most common baseline for short-term mean reversion.
Volume-Weighted Average Price (VWAP) — Popular for intraday traders; resets each session.
Statistical spread — Used in pairs trading: the mean is the historical price ratio or log-spread between two correlated assets.
Fundamental value — Some discretionary traders anchor to P/E-implied fair value rather than a moving average.
Step 2 — Measure the Deviation
Once you have your mean, you need to quantify how far price has strayed. This is typically expressed in standard deviations — the statistical concept that underpins Bollinger Bands, z-scores, and most professional mean reversion models.
A z-score is the most direct measurement: it tells you how many standard deviations away from the mean the current price sits. A z-score of +2.0 means the asset is 2 standard deviations above average — historically a signal of overextension. A z-score of −2.0 suggests the opposite.
Step 3 — Set Entry and Exit Rules
Entry is triggered when price reaches your threshold of deviation. Exit is typically set at the mean (full reversion) or a partial reversion target. A stop-loss is placed on the other side of the entry to cap losses if the trend continues rather than reverting.
Rule of Thumb
A clean mean reversion setup has an entry at 2+ standard deviations from the mean, a profit target at the mean, and a stop-loss at 3+ standard deviations. Risk-to-reward should be at least 1.5:1.
Key Indicators for Mean Reversion Stocks and Markets
Traders use a handful of technical tools to spot opportunities in mean reversion stocks. Each measures the same thing differently:
Indicator | Buy Signal | Sell Signal | Best For |
|---|---|---|---|
Bollinger Bands | Price touches lower band | Price touches upper band | Equities, ETFs |
RSI (14) | RSI < 30 | RSI > 70 | All markets |
Z-Score | Z < −2.0 | Z > +2.0 | Pairs / stat arb |
VWAP | Price far below VWAP | Price far above VWAP | Intraday trading |
Spread (Pairs) | Spread below −2σ | Spread above +2σ | Correlated pairs |
Mean Reversion Investing: Common Strategy Types
1. Single-Asset Reversion
The simplest form: buy a stock that's dropped far from its 20-day moving average, sell it when it returns to the average. Works well in calm, range-bound markets for large-cap, liquid names. The risk: a stock in a genuine downtrend can keep going down for weeks while you're long.
2. Pairs Trading (Statistical Arbitrage)
This is where mean reversion investing becomes genuinely sophisticated — and genuinely market-neutral. Instead of betting on the absolute direction of one asset, you bet on the relative performance of two historically correlated assets.
If AAPL and GOOG typically trade in a predictable ratio and that ratio suddenly diverges — AAPL up, GOOG flat — a pairs trader will short AAPL and long GOOG, expecting the spread to close. The position is hedged: if the whole market falls, both legs fall together and the spread is what matters.
This is not theoretical. Surmount's live AAPL/GOOG arbitrage strategy runs exactly this logic — more on that below.
3. Gap Fade Strategies
Stocks that open with large gaps — up or down from the prior close — fill those gaps at a statistically meaningful rate. Gap fade traders enter against the opening direction, targeting a fill of at least 50% of the gap. This is pure mean reversion applied to opening price action.
4. Volatility Mean Reversion
The VIX, the market's "fear gauge," is famously mean-reverting. Spikes above 30–35 historically precede sharp declines back to the long-run average of 15–20. Options traders use this by selling volatility after spikes or buying equity exposure when fear is extreme.
Advantages and Risks of the Mean Reversion Trading Strategy
Advantages
Clear, rules-based entry and exit logic
High win rate in stable, liquid markets
Market-neutral when used in pairs format
Works well for algorithmic automation
Used by top quant funds and hedge funds
Well-studied and statistically grounded
Risks
Fails badly in strong trending markets
Assets can stay "extended" for weeks
Requires strict stop-losses to survive
Mean itself shifts over time (drift risk)
Crowded strategies lose edge over time
News catalysts can invalidate the setup instantly
When NOT to use mean reversion
Avoid mean reversion setups during strong macro trends, earnings seasons for individual names, or after major structural breaks (sector disruption, regulatory change). The strategy assumes the underlying relationship is stable — when it isn't, the model is wrong.
A Real-World Mean Reversion Strategy: AAPL vs GOOG
Most articles about mean reversion give you theory. Here's what sets this one apart: there is a live, deployable strategy on Surmount that runs a real statistical arbitrage model on Apple (AAPL) and Alphabet (GOOG) — two of the most traded, most correlated large-cap tech stocks in the world.
AAPL and GOOG have a documented cointegration relationship. They're both exposed to the same macro factors: advertising spend, consumer confidence, dollar strength, and broad tech sentiment. Over time, their relative valuations stay within a predictable band. When that band stretches — for example, AAPL rallies sharply on a product announcement while GOOG lags — the strategy identifies the divergence, goes long the laggard, and shorts the leader, then unwinds when the spread closes.
This is mean reversion investing in one of its purest forms: no directional market bet, no macro prediction required. Just the spread, the signal, and the trade.
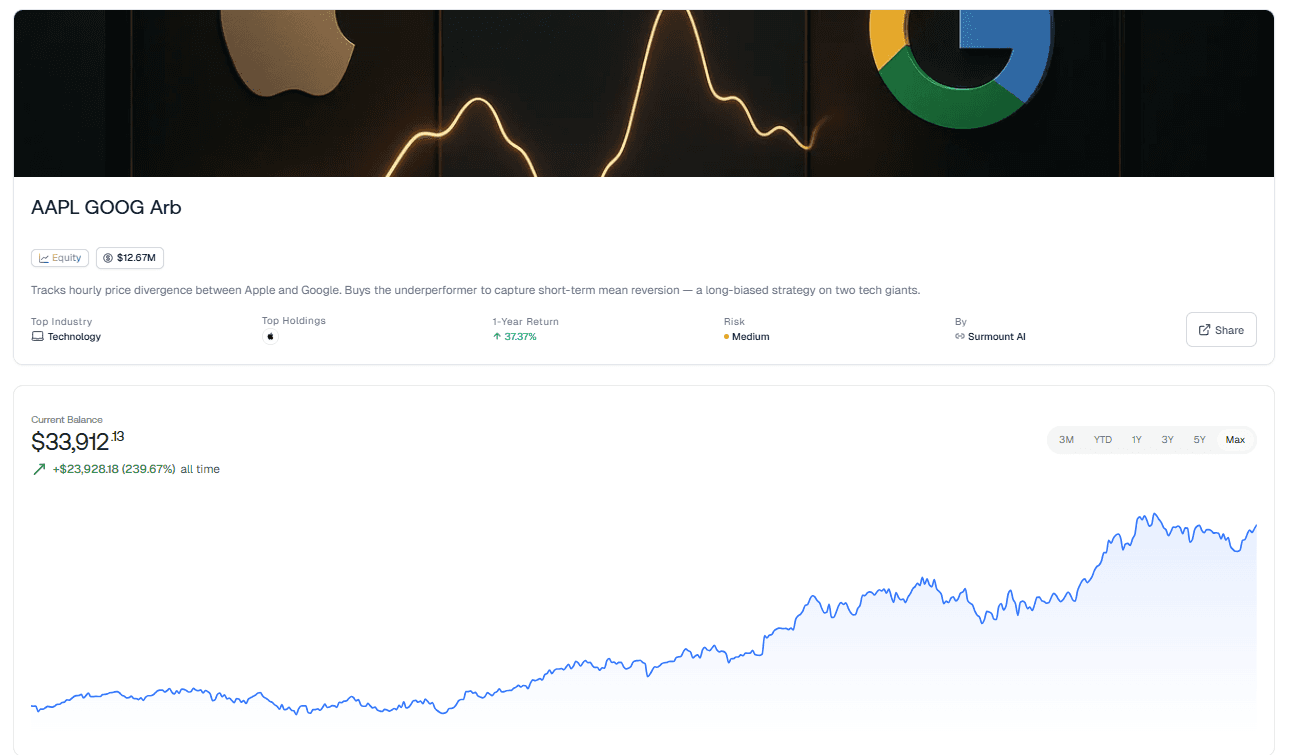
What makes Surmount's implementation powerful is automation. You don't need to watch the spread every day, calculate z-scores manually, or execute two trades in precise sizing. The platform handles signal detection, position sizing, and execution. You connect your broker, set your parameters, and the strategy runs — whether the market is open or not.
See our library of automated strategies here.
Mean Reversion vs. Momentum: Choosing the Right Regime
Mean reversion and momentum are essentially opposites — and both work, in the right conditions. The key is regime detection:
Factor | Mean Reversion Works | Momentum Works |
|---|---|---|
Market regime | Range-bound, sideways | Trending, directional |
Volatility | Low to moderate VIX | Rising, directional vol |
Time horizon | Days to weeks | Weeks to months |
Win rate | Higher (smaller wins) | Lower (larger wins) |
Best assets | Large-cap, liquid, correlated pairs | Small-cap, sector leaders, breakouts |
Professional quant traders often run both — a momentum sleeve and a mean reversion sleeve — to smooth returns across different market environments. The AAPL/GOOG strategy on Surmount is designed for mean reversion conditions, making it a natural complement to any directional strategy you're already running.
Check out our breakdown of momentum-based strategies here.
How to Get Started with Mean Reversion on Surmount
Building a mean reversion strategy from scratch requires data, backtesting infrastructure, statistical modeling, and reliable execution — a serious lift for most individual investors. Surmount removes that barrier. The platform lets you browse, analyze, and deploy professionally designed automated strategies directly to your brokerage account.
For mean reversion specifically, you can:
Browse the strategy library and filter by strategy type (stat arb, pairs, reversion)
Review performance history, drawdown metrics, and signal logic before deploying
Connect your existing broker — Surmount supports major brokerages
Set your position size, risk limits, and go live
There's no coding required, no need to build your own backtester, and no manual trade execution. See pricing plans to find the right tier for your portfolio.
FAQs
Q: What is mean reversion?
Mean reversion is the financial theory that asset prices tend to return to their historical average over time after an extreme move in either direction. It's based on the idea that markets overreact to news and sentiment, pushing prices too far — and that once the overreaction fades, prices normalize back toward their long-run mean.
Q: Does mean reversion work in all market conditions?
No — mean reversion works best in range-bound, sideways markets with stable correlations. It breaks down in strong trending conditions, where an "oversold" asset can keep falling for weeks. Most experienced traders use regime filters (like VIX levels or trend indicators) to avoid deploying mean reversion strategies into a trending market.
Q: What's the difference between mean reversion and pairs trading?
Pairs trading is a specific type of mean reversion strategy. Instead of betting on a single asset returning to its own average, you trade the spread between two correlated assets — like AAPL and GOOG — expecting it to revert to its historical norm. The advantage is market neutrality: because you're long one and short the other, broad market moves affect both legs and largely cancel out.
Q: How do I know when a price has deviated enough to trade?
Most traders use a z-score threshold of ±2.0 standard deviations as their entry trigger — meaning the price (or spread) has moved far enough from the mean to make a reversion trade statistically worthwhile. Bollinger Bands and RSI readings below 30 or above 70 are simpler alternatives that capture the same idea with less math.

Automate any portfolio using data-driven strategies made by top creators & professional investors. Turn any investment idea into an automated, testable, and sharable strategy.


