Vetting Trading Strategies: Red Flags and Green Flags Before You Invest
Surmount Blogs
Learn how to vet trading strategies before investing. Understand Sharpe ratio, Calmar ratio, maximum drawdown, and red flags that signal overfitting or curve-fitted systems.

The explosion of algorithmic trading platforms has democratized sophisticated investment strategies. But here's the uncomfortable truth: most strategies that look brilliant in backtests crumble when exposed to real markets.
The difference between profitable trading and portfolio destruction often comes down to vetting strategies before risking capital. Understanding which metrics matter, which red flags scream danger, and which green flags signal genuine edge can save you from expensive mistakes.
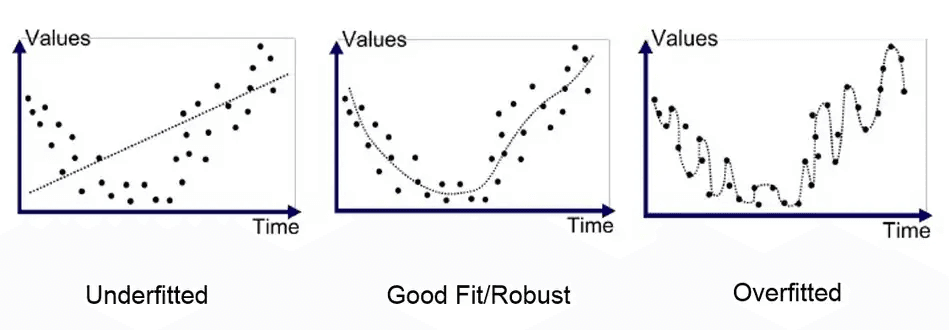
The Backtest Illusion: When Perfect Is a Problem
If your backtest looks too good to be true, it probably is. Markets are messy and unpredictable. A strategy showing smooth upward curves with minimal drawdowns and triple-digit returns? That's overfitting, not skill.
Critical red flags of overfitting:
Unrealistic returns: Triple-digit annual gains with minimal drawdowns
Too-smooth equity curves: Real strategies experience volatility and gut-punch moments
Inconsistent cross-asset performance: Works on Apple but fails on Microsoft
Excessive complexity: Dozens of parameters create overfitting magnets
Poor out-of-sample results: Studies found 44% of published strategies couldn't replicate success on new data
Overfitting means the strategy memorized past price movements rather than learning genuine market principles. It captured noise, not signal.
The Risk-Adjusted Metrics That Actually Matter
Absolute returns tell an incomplete story. A 50% annual gain with 60% drawdowns would psychologically destroy most traders. Sophisticated investors focus on risk-adjusted performance metrics.
Sharpe Ratio: The Industry Standard
The Sharpe Ratio measures return per unit of volatility.
Formula: (Portfolio Return - Risk-Free Rate) / Standard Deviation
Interpretation:
Sharpe > 2.0: Excellent
Sharpe 1.0-2.0: Good, acceptable
Sharpe < 1.0: Poor risk-reward relationship
Limitation: Penalizes both upside and downside volatility equally.
Sortino Ratio: Isolating Downside Risk
The Sortino Ratio improves on Sharpe by only penalizing negative movements below a target return.
Why it matters:
Aligns with investor psychology (we welcome upside volatility)
Provides accurate risk assessment for asymmetric returns
Better for capital preservation-focused strategies
A Sortino > 2.0 indicates strong returns without excessive downside risk.
Calmar Ratio: The Drawdown Reality Check
The Calmar Ratio evaluates returns relative to maximum drawdown—the largest peak-to-trough decline.
Formula: Annualized Return / Maximum Drawdown
Interpretation:
Calmar > 3.0: Excellent
Calmar 1.0-3.0: Acceptable
Calmar < 1.0: Warning—losses exceed returns
Maximum drawdowns devastate compounding. Research shows:
30% drawdown requires 42.9% gain to break even
50% drawdown requires 100% gain to recover
60% drawdown requires 150% gain to return to breakeven
Maximum Drawdown: The Non-Negotiable Metric
Maximum drawdown (MDD) reveals a strategy's true character—the largest percentage decline from peak to trough before a new peak emerges.
MDD < 10%: Conservative, low-risk
MDD 10-20%: Moderate risk, acceptable for most
MDD 20-30%: Aggressive, requires strong tolerance
MDD > 30%: High risk, consider if recovery is realistic
Critical questions:
Can you emotionally handle this loss without abandoning the strategy?
Does your capital structure support this drawdown?
How long did recovery take historically?
Win Rate Versus Payoff: The Balance That Matters
Many traders obsess over win rate—but win rate alone tells you nothing about profitability.
A strategy winning 80% of the time sounds impressive until winners average $100 while losers average $600. That's portfolio destruction despite frequent wins.
The expectancy equation:
Average Profitability = (Win Rate × Average Win) - (Loss Rate × Average Loss)
Examples:
Scenario A: 30% win rate, 3:1 payoff ratio = Potentially profitable
Scenario B: 70% win rate, 1:3 payoff ratio = Likely unprofitable
Research shows you need approximately 80% win rate to compensate for a 1:3 risk-reward ratio.
Sample Size and Statistical Significance
A strategy showing 10 consecutive winners means nothing statistically. You need sufficient trade sample size to distinguish skill from luck.
Guidelines:
< 30 trades: Statistically meaningless
30-100 trades: Minimal relevance
100-300 trades: Reasonable confidence
> 300 trades: Strong statistical foundation
Out-of-Sample Testing: Your First Defense
The first defense against curve-fitting is out-of-sample testing—validating performance on unseen data.
Proper methodology:
In-sample: 70-80% of data for development
Out-of-sample: 20-30% held back for validation
Never optimize using out-of-sample data
Green flags:
Performance degrades < 20% from in-sample
Sharpe/Sortino ratios remain positive
Maximum drawdown stays within parameters
Red flags:
Dramatic performance collapse
Negative returns after stellar in-sample results
Complete failure during regime changes
Parameter Sensitivity: The Stability Test
Parameter sensitivity testing reveals whether you've found genuine edge or lucky numbers.
Green flags—robust parameters:
Performance degrades gradually with changes
Strategy remains profitable across parameter ranges
Multiple combinations deliver acceptable results
Red flags—curve-fitted parameters:
Minor changes destroy profitability
Single "magic" parameter set far outperforms others
No logical explanation for why parameters work
Green Flags: What Robust Strategies Look Like
Hallmarks of quality strategies:
Logical foundation:
Clear explanation for why the edge exists
Based on observable market behavior
Exploits genuine inefficiencies
Consistent across dimensions:
Multiple assets showing similar results
Various timeframes producing comparable performance
Multiple years of validation
Realistic performance:
Moderate, sustainable returns
Drawdowns proportionate to gains
Sharpe ratio > 1.0, ideally > 1.5
Statistical significance:
Large trade sample (hundreds minimum)
Positive expectancy across subperiods
Performance not dependent on outliers
The Modern Vetting Solution
Surmount exemplifies platforms built specifically to help investors vet strategies with institutional-grade rigor.
Comprehensive metrics display:
Every strategy shows the analytics that separate professionals from amateurs:
Sharpe, Sortino, and Calmar ratios
Maximum drawdown with recovery analysis
Win rate, expectancy, and profit factor
Detailed trade distribution
Backtesting transparency:
Complete visibility into performance:
Full historical backtests across market regimes
Out-of-sample validation results
Performance by market condition
Trade-by-trade analysis
Built-in robustness testing:
Recent enhancements address vetting challenges:
Improved backtesting speed for parameter testing
Alternative data integration including sentiment analysis
Dynamic rebalancing adapting to conditions
Multi-asset validation
Three sophistication levels:
No-code: Browse verified strategies, compare metrics, deploy with transparency
Low-code: Modify strategies visually, test variations, validate through backtesting
Full Python: Build custom strategies, access complete data, implement advanced risk management
The marketplace advantage:
Strategy creators can monetize successful algorithms, creating incentive alignment:
Creators often trade their own strategies
Real money validates backtest claims
Competition drives refinement
Access diversified uncorrelated strategies
Before deployment, you see comprehensive metrics, complete backtests, and risk analyses. No hidden performance. No cherry-picked periods.
Making Better Decisions
The metrics we've explored—Sharpe, Sortino, Calmar, maximum drawdown, win rate, expectancy—aren't just numbers. They're your defense against expensive mistakes.
Key principles:
Skepticism beats optimism: Question perfect backtests
Context matters: Understand regimes, costs, constraints
Metrics work together: No single measure tells all
Robustness trumps optimization: Strategies working across conditions win
Transparency is non-negotiable: Demand complete visibility
Whether evaluating marketplace strategies or building custom algorithms, these principles remain constant. Successful algorithmic trading requires marrying sophisticated technology with rigorous analytical discipline. At Surmount, every strategy on our platform undergoes the same rigorous vetting process outlined above. Investors can view key risk-adjusted metrics like Sharpe, Calmar ratios, alongside detailed drawdown analyses, trade distributions, and out-of-sample results—all before allocating a single dollar. Transparency and data integrity aren’t afterthoughts; they’re the foundation of how we help investors separate genuine edge from illusion.
The tools exist. The strategies exist. The question is whether you'll invest time to vet them properly—or learn expensive lessons in live trading that backtesting should have taught you for free.

Automate any portfolio using data-driven strategies made by top creators & professional investors. Turn any investment idea into an automated, testable, and sharable strategy.


