Risk Models & Drawdown Control: Techniques in Algorithmic Investing
Surmount Blogs
Master risk management in algorithmic investing. Learn proven drawdown control techniques, position sizing strategies, and risk metrics that protect capital.

Your portfolio hits an all-time high. You're up 35% for the year, riding a hot tech momentum strategy that's been printing money for months. Then the market shifts. Three weeks later, you're down 28% from that peak and staring at returns that are now negative for the year.
Do you hold? Cut losses? Add more? Every instinct is screaming different advice, and you're frozen, watching your gains evaporate in real-time.
This is where most investors—even sophisticated ones—break. Not because they picked bad stocks or mistimed the market, but because they never asked the critical question before deploying capital: What happens when this thing breaks?
Risk management isn't the boring compliance stuff your broker's disclaimer mentions. It's the difference between surviving market chaos and becoming a cautionary tale. Here's what nobody tells retail investors: the best algorithmic traders don't win because they're right more often. They win because they've built systems that control drawdowns ruthlessly.
The $4.6 Billion Lesson Nobody Learned
When Long-Term Capital Management collapsed in 1998 with a 92% drawdown, it wasn't because their Nobel Prize-winning economists couldn't do math. They had the smartest people in finance, the most sophisticated models, and leverage that made them feel invincible. What they didn't have was a plan for when correlations went to one.
Fast forward a decade. The 2008 financial crisis saw the S&P 500 experience a maximum drawdown of approximately 55%. Diversification—the supposed free lunch of investing—failed spectacularly. During market crises, risky asset classes exhibit "contagion" effects, with highly correlated losses across the board.
The survivors weren't the ones with better predictions. They were the ones with better risk models.
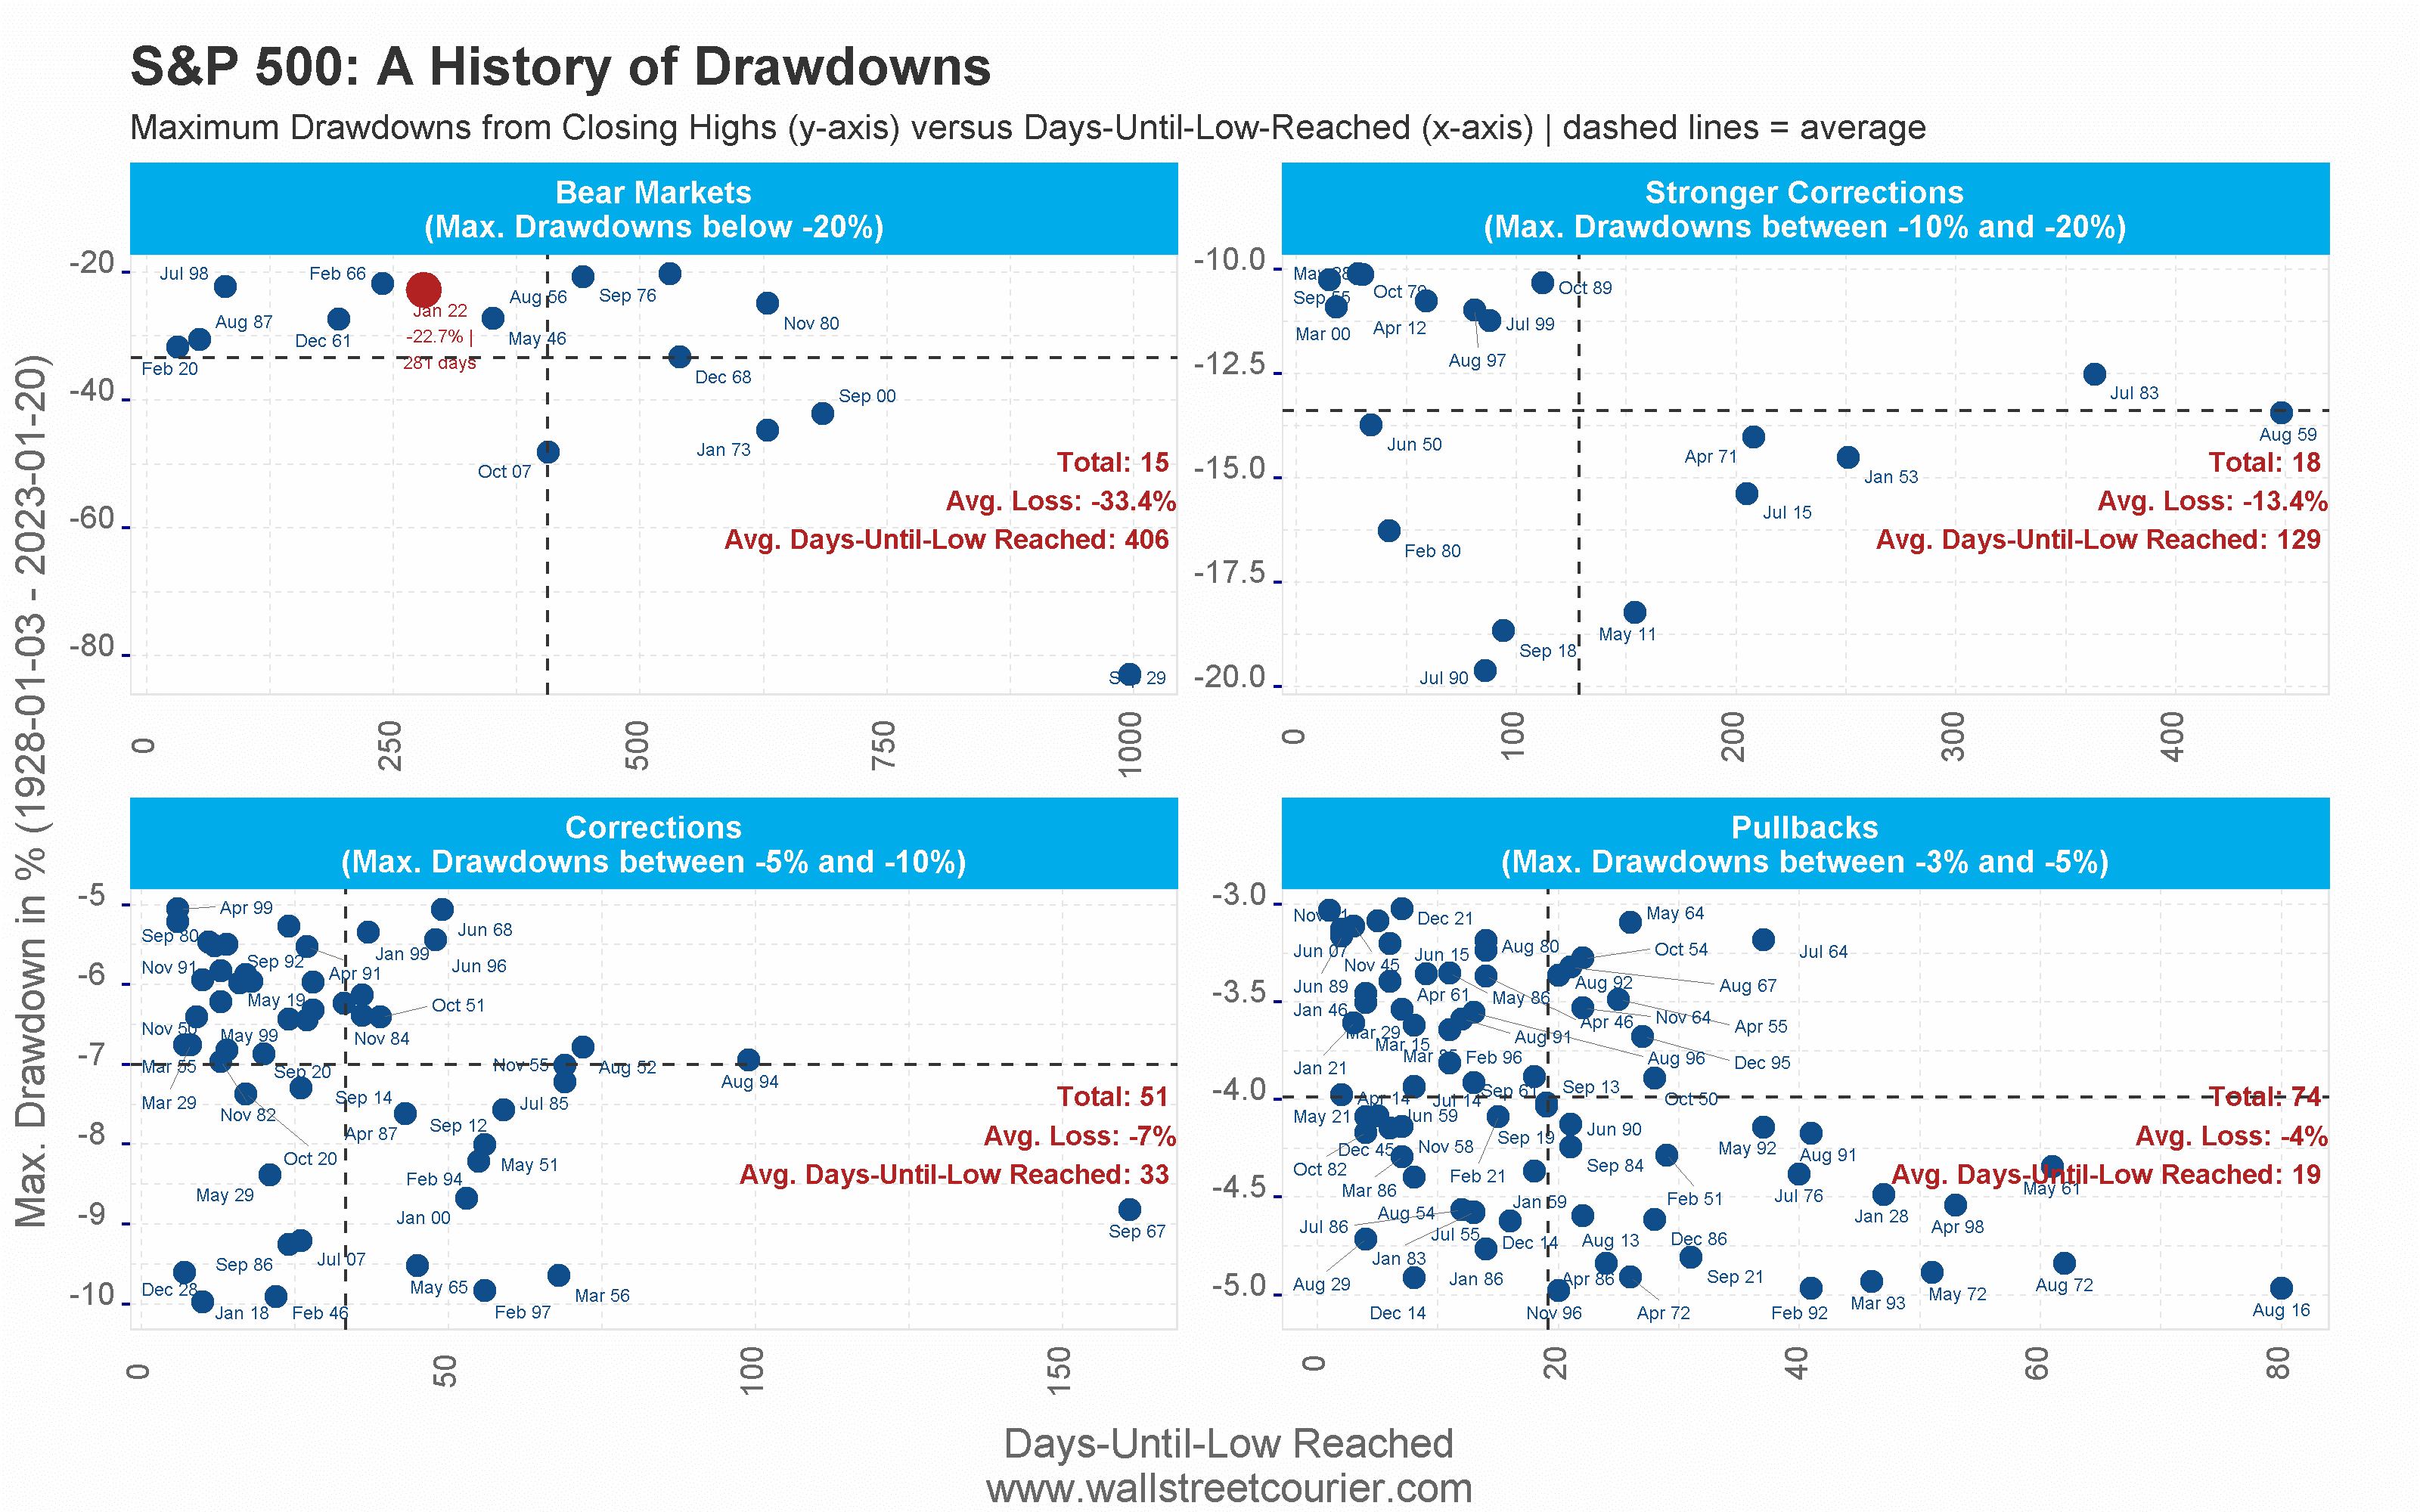
What Drawdown Actually Means (And Why You Should Care More Than You Do)
Drawdown is the decline from peak to trough in your portfolio value. Simple concept, profound implications.
Maximum drawdown (MDD) measures the largest peak-to-trough decline during a specific time period. If your portfolio grows from $100,000 to $150,000, then drops to $90,000, your maximum drawdown is 40% ($150,000 - $90,000 / $150,000). Not 40% from your starting point—40% from your peak.
Here's the psychological trap: a 50% loss requires a 100% gain just to break even. Lose 75%? You need a 300% gain. The math is brutal, and it gets inside your head in ways that spreadsheets never capture.
Among hedge funds and commodity trading advisors, maximum drawdown is one of the most widely quoted risk measures—more meaningful than volatility, more honest than Sharpe ratio, more predictive of investor behavior. Why? Because humans can tolerate volatility when the trend is up. But watching your portfolio crater by 40% breaks people. They panic, sell at the bottom, and lock in permanent losses.
The Core Risk Metrics That Actually Matter
Traditional risk management focuses on volatility—how much your returns bounce around. That's like judging a rollercoaster by average speed while ignoring that it occasionally goes upside-down.
Value at Risk (VaR): A VaR of $500,000 at 95% confidence for one day means there's a 95% probability of losing no more than $500,000. Sounds precise, right? It's also dangerously incomplete.
VaR tells you nothing about the magnitude of losses beyond that threshold. You could lose $500,001 or $50 million—VaR doesn't care. It's like a weather forecast that says "95% chance precipitation stays below one inch" while ignoring the possibility of a Category 5 hurricane.
Conditional Value at Risk (CVaR): This is where it gets real. CVaR quantifies the expected loss beyond the VaR threshold, answering the question VaR ignores: "When things go wrong, how wrong do they go?"
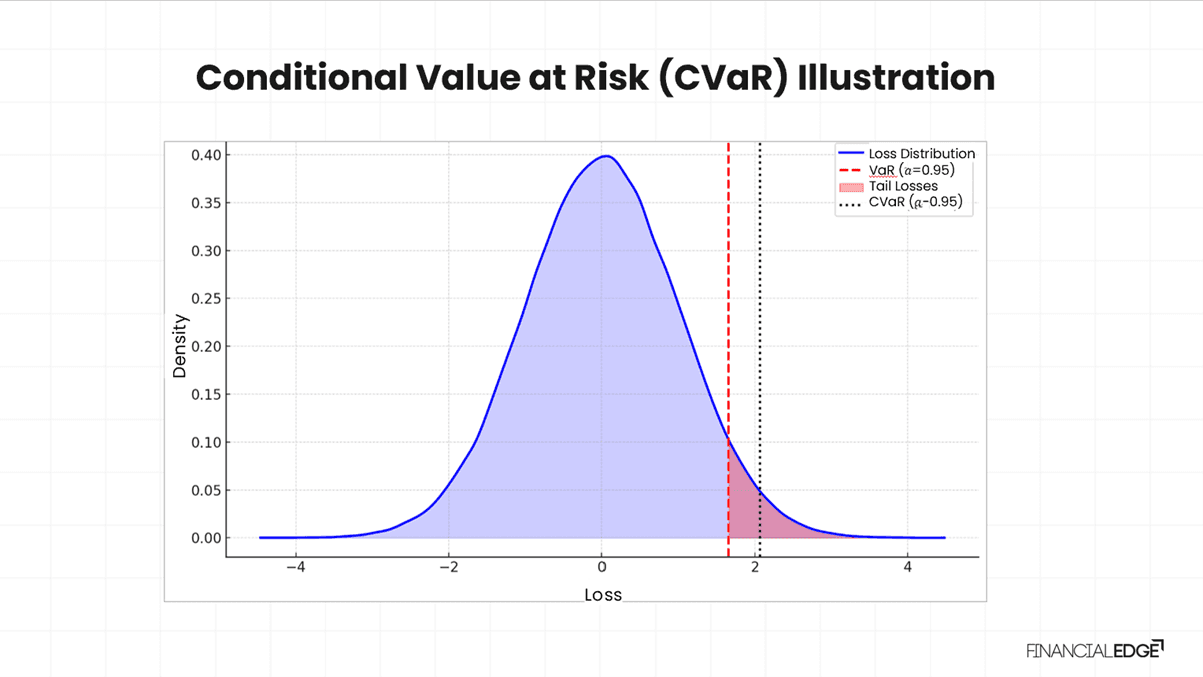
A one-day 99% CVaR of $12 million means the expected loss in the worst 1% of scenarios is $12 million. CVaR is what keeps institutional traders employed—Basel III regulations now require banks to use Expected Shortfall (another name for CVaR) instead of VaR for calculating market risk capital.
Conditional Drawdown at Risk (CDaR): The nuclear option of risk metrics. CDaR applies extreme value theory to the drawdown distribution itself, measuring the average of all drawdowns exceeding a particular level. It's CVaR's scarier cousin who actually understands what happens during market dislocations.
Position Sizing: The Skill Nobody Teaches
Ask ten retail investors how they size positions and nine will say something like "I put 5% in each stock" or "I go bigger on my highest-conviction ideas." Both approaches are recipes for eventual ruin.
Percentage-Based Sizing: Limiting each position to 1-3% of total capital is the entry-level approach. Simple, but doesn't account for the fact that a volatile biotech stock and a stable utility stock carry vastly different risks.
Volatility-Based Sizing: Better. Scale position size inversely with volatility—smaller positions in volatile assets, larger in stable ones. This normalizes risk across your portfolio rather than just normalizing capital allocation.
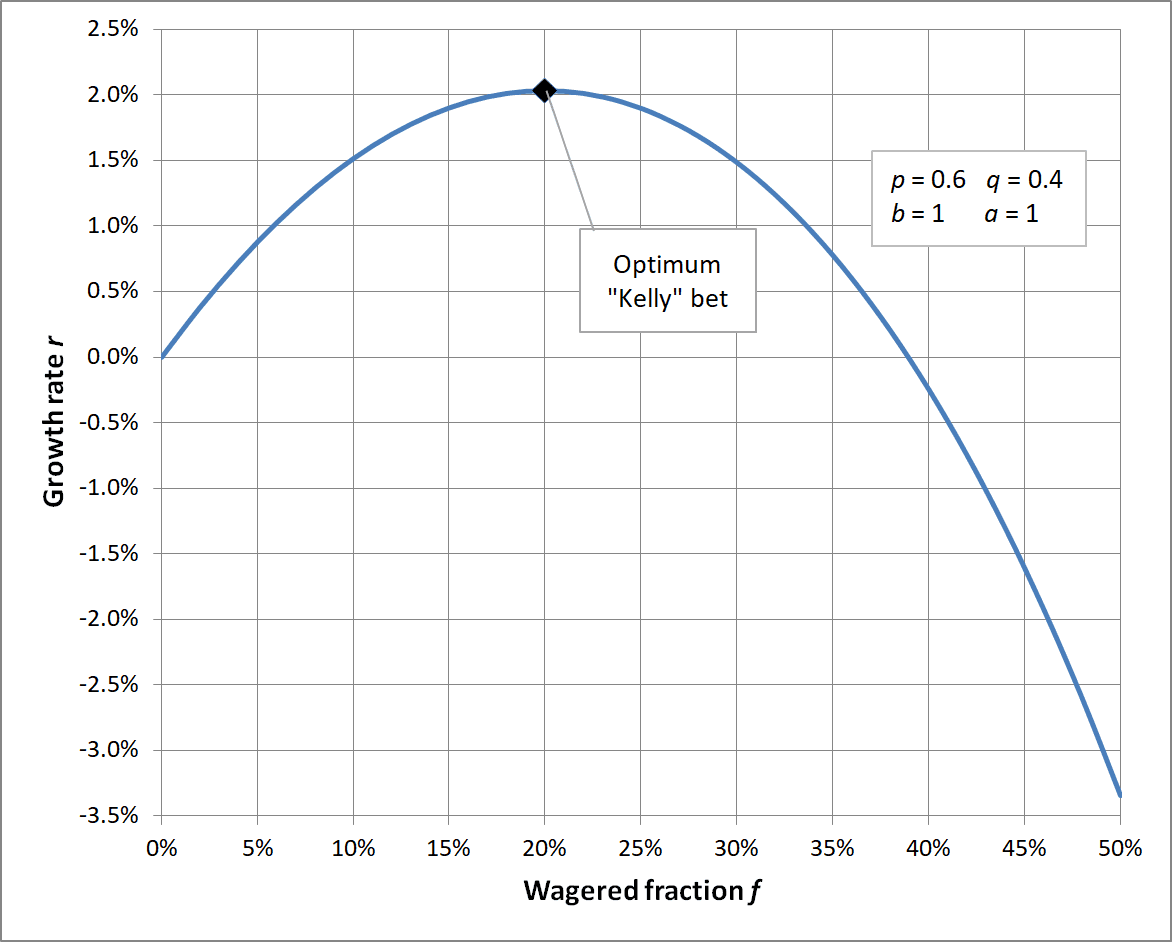
The Kelly Criterion: Now we're cooking. The Kelly Criterion determines optimal position size by maximizing long-term growth rate based on your edge and the payoff distribution.
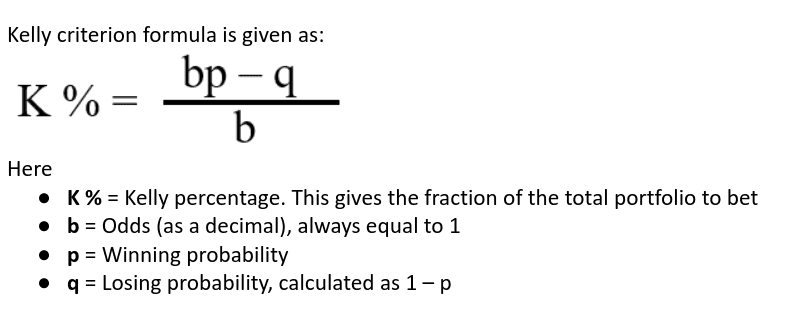
If you have a 52% chance of winning with 1:1 odds, Kelly says bet 4% of your capital. Elegant in theory. Terrifying in practice.
Why? Because Kelly assumes you know the true probabilities and can make infinite bets. Get those probabilities wrong and full Kelly will blow you up. That's why most professional traders use half-Kelly or quarter-Kelly—betting a fraction of what the formula suggests to account for estimation error.
A study testing Kelly on participants with a 60% winning coin flip found that 28% went bust despite favorable odds, with the average payout just $91 out of a potential $250. The theory was sound. Human implementation was catastrophic.
Stop-Loss Strategies (And Why Yours Probably Sucks)
"I'll just use a stop-loss" is the investment equivalent of "I'll start going to the gym next week." Everyone says it. Few do it right.
Fixed Stop-Loss: Simple but crude. Set a loss threshold—say 5%—and exit when hit. The problem is that fixed stops must be carefully placed to avoid exiting too soon during normal market fluctuations.
Trailing Stop-Loss: Better. Your stop moves up with price but never down. If a stock rises 10% and you have a 5% trailing stop, you've locked in at least a 5% gain. The genius here is that it lets winners run while protecting profits.
Volatility-Adjusted Stops: Best for algorithmic systems. Use Average True Range (ATR) or standard deviation to set stops that adapt to market conditions. A stock with 2% daily volatility gets tighter stops than one with 5% daily swings.
Time-Based Exits: Sometimes the smartest move is admitting your thesis has expired. Exit after X days regardless of P&L if the expected move hasn't materialized. Dead capital is expensive capital.
But here's the catch: stop-losses become market orders when triggered, guaranteeing execution but possibly at unfavorable prices during market gaps. Stop-limit orders let you control price but might not execute in rapidly moving markets. Pick your poison.
Dynamic Risk Management: When Markets Change, Your Risk Model Should Too
Static risk models are like wearing a winter coat in summer because the forecast called for cold weather six months ago.
Regime Detection: Markets cycle between trending, mean-reverting, and chaotic states. Algorithms can detect regime shifts through volatility clustering, correlation changes, or market breadth indicators.
When volatility spikes, smart systems reduce exposure automatically. When correlations approach 1.0 (everything moving together), diversification benefits collapse and position sizes should shrink. Platforms enable dynamic parameter adjustment based on volatility regimes and trend strength.
Performance-Based Adjustments: After consecutive losses, reduce position sizes. After a winning streak, be careful about increasing too much—markets have a way of punishing overconfidence right when you scale up.
Circuit Breakers: The nuclear option. Set maximum daily loss thresholds that automatically halt all trading. Sounds dramatic, but it prevents algorithmic meltdowns that turn bad days into career-ending disasters.
The Hidden Risk Nobody Talks About: Correlation Breakdown
You've diversified across tech, healthcare, energy, and consumer staples. Your correlation matrix looks beautiful. Then March 2020 happens and everything drops 30% simultaneously.
Trading multiple correlated instruments significantly increases drawdown risk. Your "diversified" portfolio of five tech stocks isn't diversified—it's concentrated sector exposure with extra transaction costs.
Real diversification requires:
Asset class diversification: Stocks, bonds, commodities, currencies, alternatives
Strategy diversification: Trend-following + mean reversion + arbitrage
Time horizon diversification: Mix short-term tactical trades with long-term strategic positions
Risk factor diversification: Ensure exposures to different underlying drivers of returns
During the 2008 credit crisis, US equity and US government bonds contributed almost equally to portfolio drawdown risk—correlation structures that held for decades broke down overnight.
Stress Testing: War Gaming Your Portfolio
Backtests show you how strategies performed historically. Stress tests show you how they'll perform when history doesn't repeat.
Historical Scenarios: Run your strategy through past crises. How would it have handled the 2008 crash, 2020 COVID collapse, or 1987 Black Monday? If you don't like the answers, fix the strategy before deploying real capital.
Monte Carlo Simulations: Generate thousands of potential performance scenarios to understand the range of possible drawdowns, not just the historical ones. This reveals tail risks hiding in the data.
Factor Shocks: What happens if volatility doubles? If correlations spike to 0.9? If liquidity evaporates? Systematic approaches to stress testing explore extreme market conditions that haven't happened yet but inevitably will.
The goal isn't predicting the future—it's building portfolios that survive unpredictable futures.
Real-World Implementation (How Surmount Makes This Accessible)
Professional risk management used to require a team of PhDs and proprietary infrastructure. Not anymore.
Advanced platforms now provide comprehensive pre-trade checks, real-time monitoring, and sophisticated exit strategies. But integration matters more than features.
Surmount's approach stands out because it bakes risk management into strategy design rather than bolting it on afterward. When you build or deploy strategies on Surmount, the platform doesn't just execute trades—it continuously monitors portfolio-level risk metrics, adjusts position sizes based on changing conditions, and enforces drawdown limits automatically.
The difference between amateur and professional risk management isn't complexity—it's consistency. Humans make emotional decisions during drawdowns. They violate their own rules right when rules matter most. Algorithms execute risk management decisions without emotional interference.
Surmount's marketplace allows you to see the actual risk characteristics of strategies before deploying capital—historical drawdowns, volatility profiles, worst-case scenarios. No marketing fluff, just data.
The Myths That Cost Investors Millions
Myth 1: "Diversification eliminates risk"
Diversification reduces idiosyncratic risk—individual stock blowups. It does nothing for systematic risk—market-wide crashes. When the S&P 500 dropped 56% during 2008, your diversified portfolio of US stocks still got demolished.
Myth 2: "Stop-losses guarantee you can't lose more than X%"
Tell that to anyone holding stocks during the March 2020 circuit breaker halts. Stop-losses work in liquid, orderly markets. In chaotic selloffs with gapping prices, you might get filled 10% below your stop.
Myth 3: "Low volatility = low risk"
Bernie Madoff's returns had incredibly low volatility. Zero drawdowns for years. Turned out the risk was 100% fraud. Volatility measures price fluctuation, not fundamental risk of permanent capital loss.
Myth 4: "Historical drawdowns predict future drawdowns"
The worst drawdown is always ahead of you, not behind you. Historical data is backward-looking and may not capture future regime shifts.
Building Your Risk Framework (The Practical Stuff)
Define acceptable drawdown limits - Be honest. Can you psychologically handle a 30% drawdown? 50%? Most retail investors overestimate their risk tolerance until they experience actual losses.
Implement position sizing rules - Start with simple percentage-based sizing (1-2% per position). Graduate to volatility-adjusted sizing. Eventually explore fractional Kelly when you have enough data.
Set portfolio-level risk budgets - Maximum 5% daily loss? 15% monthly drawdown? Write it down. Program it into your execution system.
Monitor correlation dynamically - Your correlation matrix from last year is worthless. Track rolling correlations and reduce exposure when everything moves together.
Backtest with realistic slippage - That beautiful backtest assuming instant fills at mid-price? Fantasy. Add transaction costs, bid-ask spreads, and realistic market impact.
Use multiple risk metrics - VaR + CVaR + Maximum Drawdown + Sharpe Ratio. No single metric tells the whole story.
Review and adjust regularly - Markets evolve, strategies decay, risk parameters need updating. Monthly at minimum, weekly during volatile periods.
The Uncomfortable Truth About Risk Management
Perfect risk management doesn't exist. Every framework makes trade-offs.
Tight stops reduce drawdowns but increase whipsaw losses from false signals. Loose stops survive volatility but expose you to larger drawdowns. High diversification reduces concentration risk but dilutes returns from your best ideas. The Kelly Criterion maximizes long-term growth but maximizes short-term volatility.
The goal isn't eliminating risk—markets pay you for bearing risk intelligently. The goal is understanding what risks you're taking, ensuring you're compensated appropriately, and surviving long enough to let compounding work.
Renaissance Technologies' Medallion Fund achieved 66% annual returns not because they avoided losses but because they managed them better than anyone else. They had bad days, bad weeks, even bad months. They never had a career-ending drawdown.
Where Most Retail Investors Go Wrong
They treat risk management as something to implement after picking strategies. Wrong order. Risk management should drive strategy selection, not follow it.
They test strategies during bull markets and assume results will persist. A strategy that looks amazing in 2019 might be catastrophic in 2020. Test through full cycles.
They confuse activity with discipline. Having 37 different indicators and rebalancing daily isn't risk management—it's hyperactivity. Risk management is about consistent execution of sound principles.
They assume algorithms eliminate all risk. Algorithms eliminate emotional risk. They don't eliminate market risk, model risk, implementation risk, or the risk that your assumptions were wrong.
The Bottom Line
Remember that scenario at the beginning—up 35%, then down to negative returns in three weeks? That's not a hypothetical. It happens to thousands of investors every market cycle. The difference between those who recover and those who quit forever isn't luck or skill—it's having a risk framework in place before the drawdown hits.
Your algorithm can be brilliant. Your signals can be statistically significant. Your backtests can be gorgeous. None of it matters if you don't survive your first real drawdown.
Platforms like Surmount democratize access to institutional-grade risk management tools. But tools don't make you disciplined—they make discipline scalable. You still need to define your risk tolerance, set sensible limits, and stick to them when markets test your conviction.
Start small. Test your risk controls with money you can genuinely afford to lose. Watch how you feel during the inevitable drawdowns. Adjust your framework based on emotional reality, not theoretical risk tolerance.
And remember: in algorithmic investing, the goal isn't making money every day. It's still being in the game when your edge eventually pays off.
Disclaimer: This article is for educational purposes only and does not constitute financial advice. Algorithmic trading involves substantial risk of loss. Past performance does not guarantee future results. Always consult with a licensed financial advisor before making investment decisions.

Automate any portfolio using data-driven strategies made by top creators & professional investors. Turn any investment idea into an automated, testable, and sharable strategy.


