The Last Week of December: Why Year-End Markets Are the Most Misleading of the Yea
Surmount Blogs
Late December markets mislead investors with thin liquidity, false breakouts, and failed seasonal patterns. Learn why the 2024 Santa rally reversed, why January Effect patterns vanished, and how smart investors navigate year-end trading distortions.

The final trading days of December consistently produce some of the year's most deceptive market signals. While headlines celebrate year-end rallies and investors scan charts for January momentum, experienced traders know better: thin liquidity distorts everything.
When Volume Vanishes, Mirages Appear
Market liquidity during the holiday period doesn't just decline—it collapses. According to Russell Investments' 2024 analysis, global equity volumes typically fall to 45-70% of normal levels between December 23 and New Year's Day. Foreign exchange markets fare worse, with Christmas Eve and Boxing Day volumes running at roughly 20% of normal.
This creates what traders call a "liquidity vacuum." In December 2024, U.S. exchange volume ran at approximately 64% of its normal pace—a classic year-end drought where every trade carries outsized impact.
The mechanics are straightforward:
Institutional traders step away for holidays
Market depth at key price levels thins dramatically
Individual orders move prices disproportionately
Bid-ask spreads widen as market makers reduce exposure
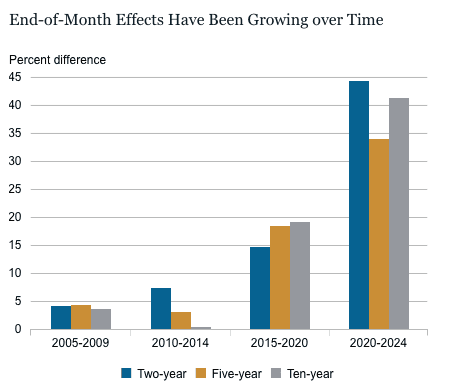
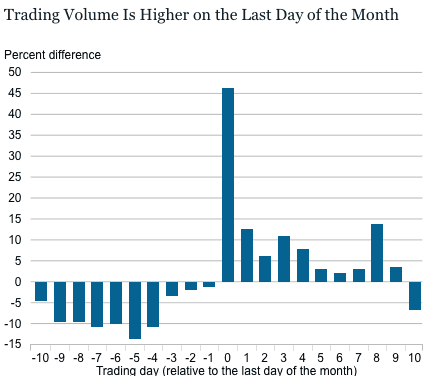
The Federal Reserve Bank of New York documented this phenomenon precisely. Since 2020, Treasury trading activity jumps 33% on the last trading day of each month, with price impact coefficients dropping 26% during these periods—evidence that normal market structure breaks down entirely.
The Santa Claus Rally That Wasn't
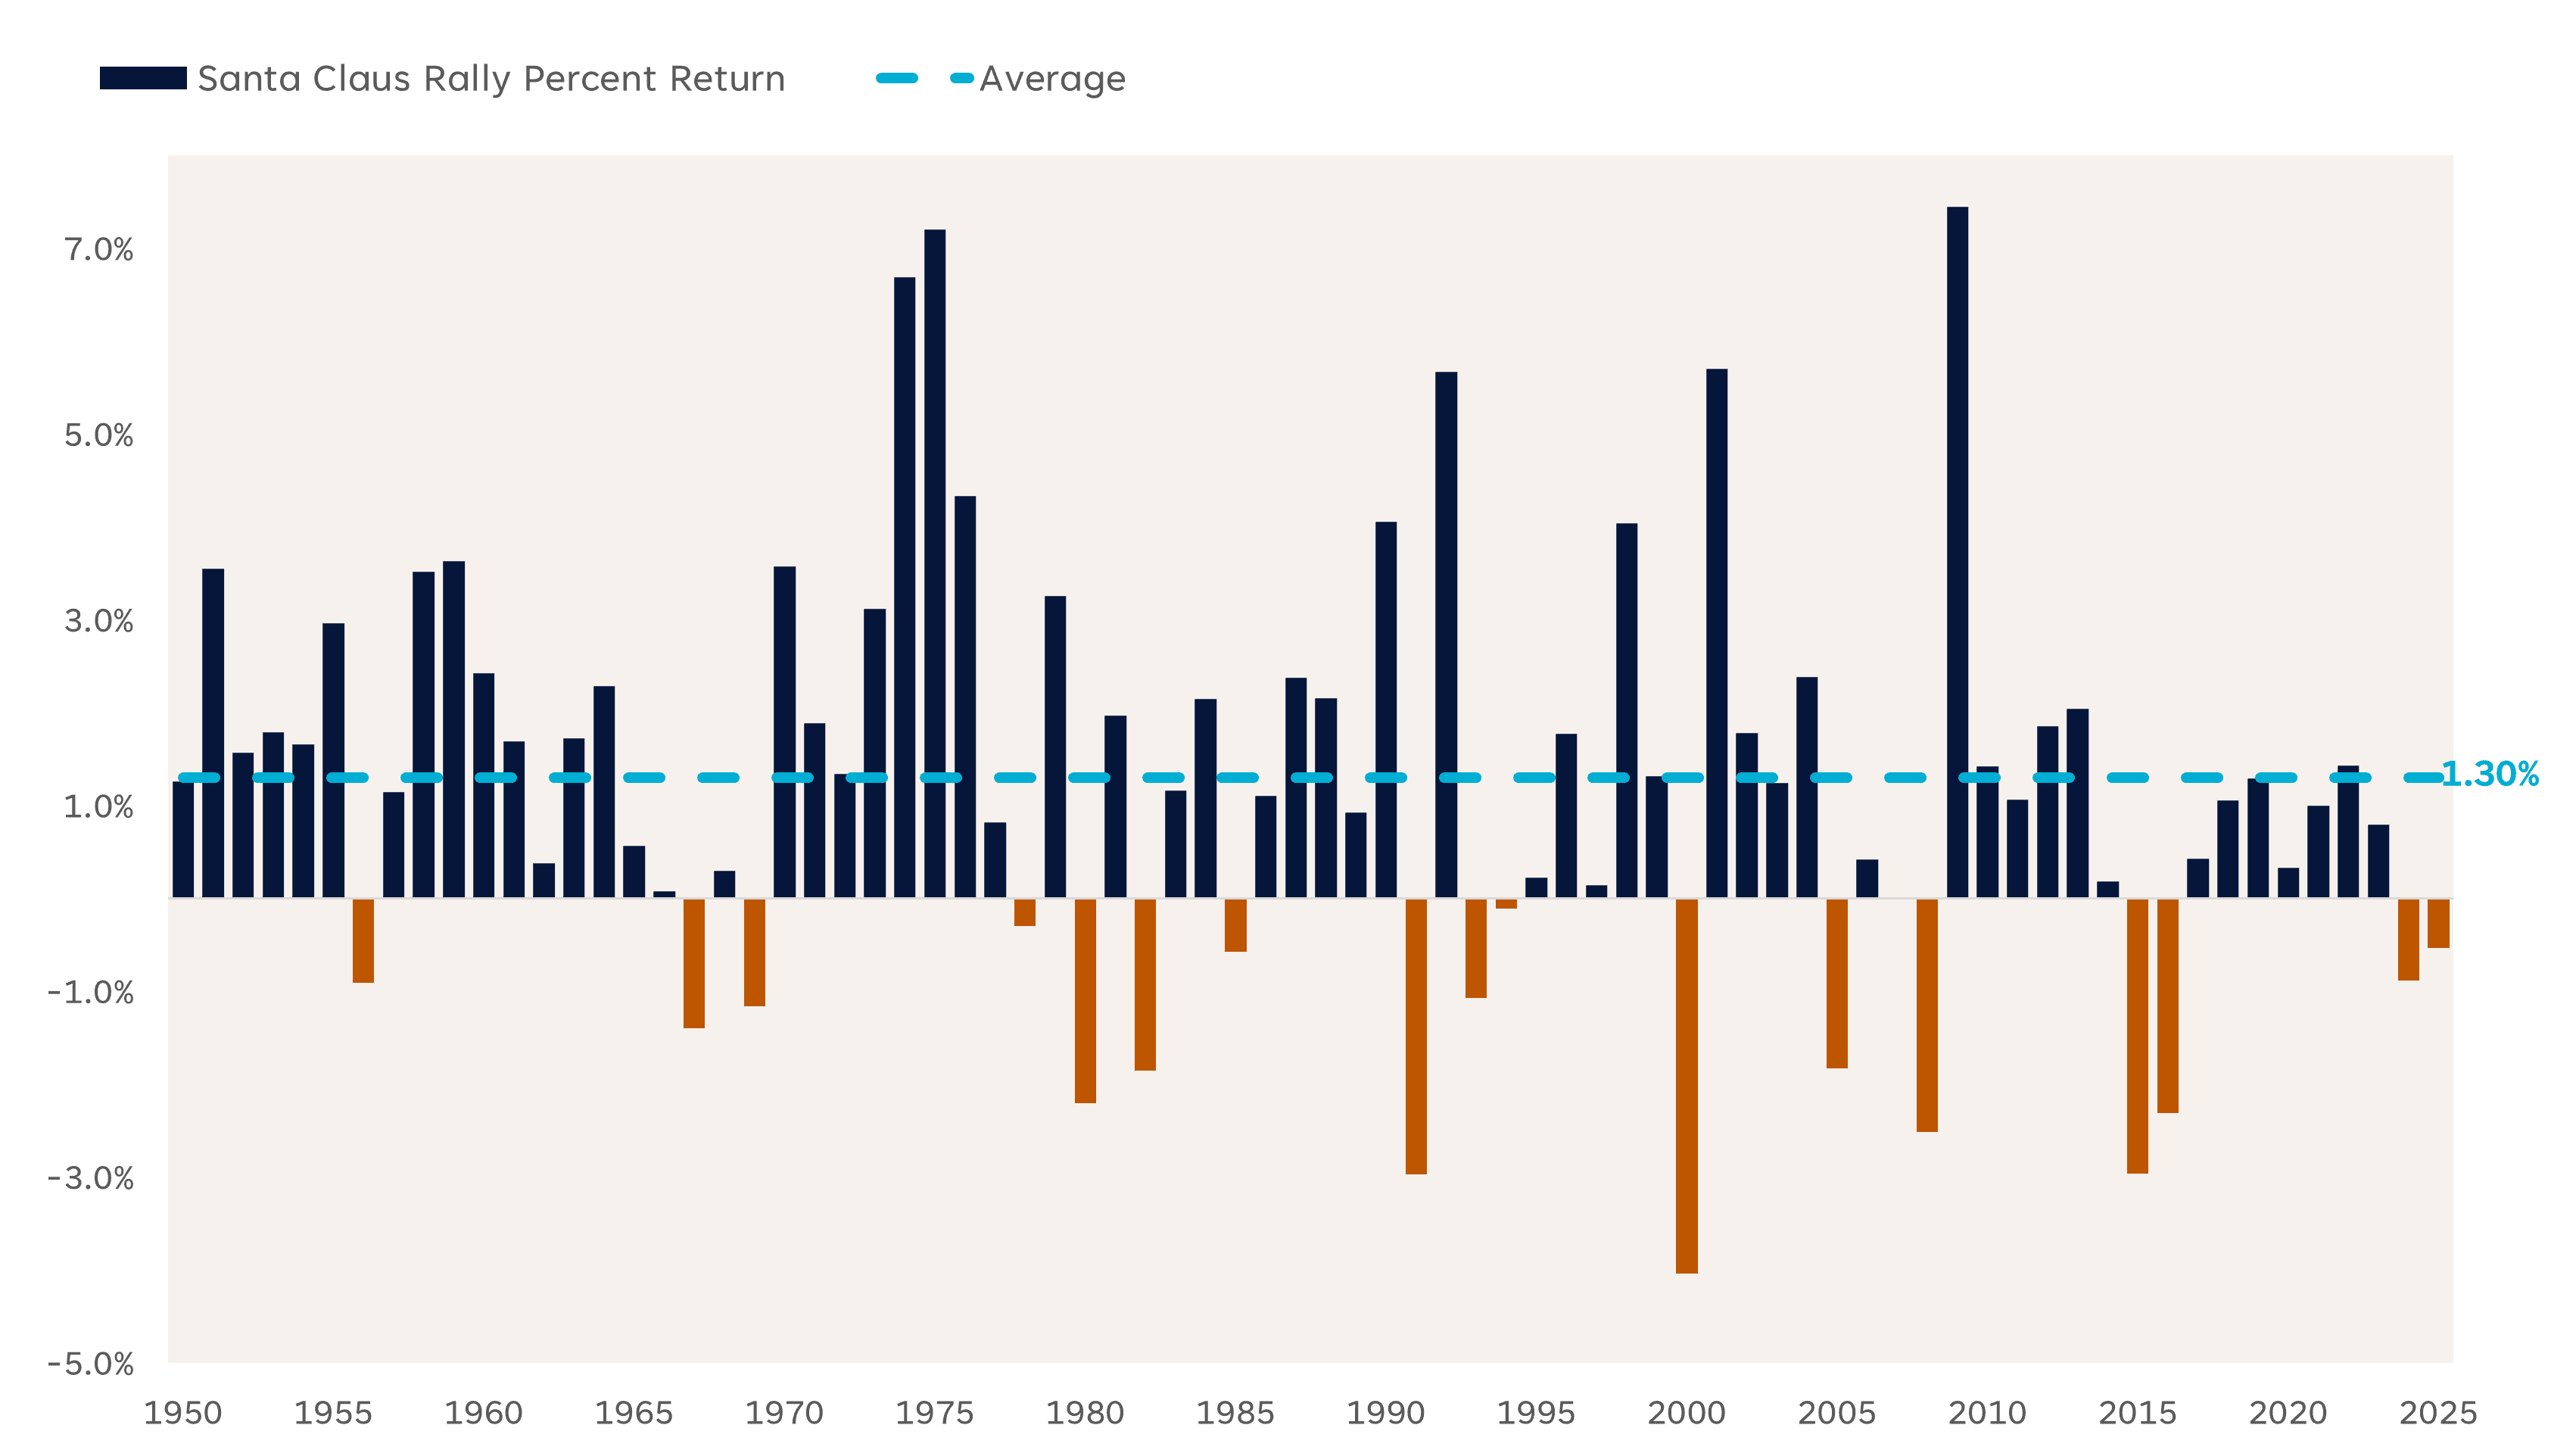
For decades, the "Santa Claus rally"—a 1.3% average gain during the last five trading days of December and first two of January—appeared reliable. Historical data shows positive returns roughly 79% of the time since 1950.
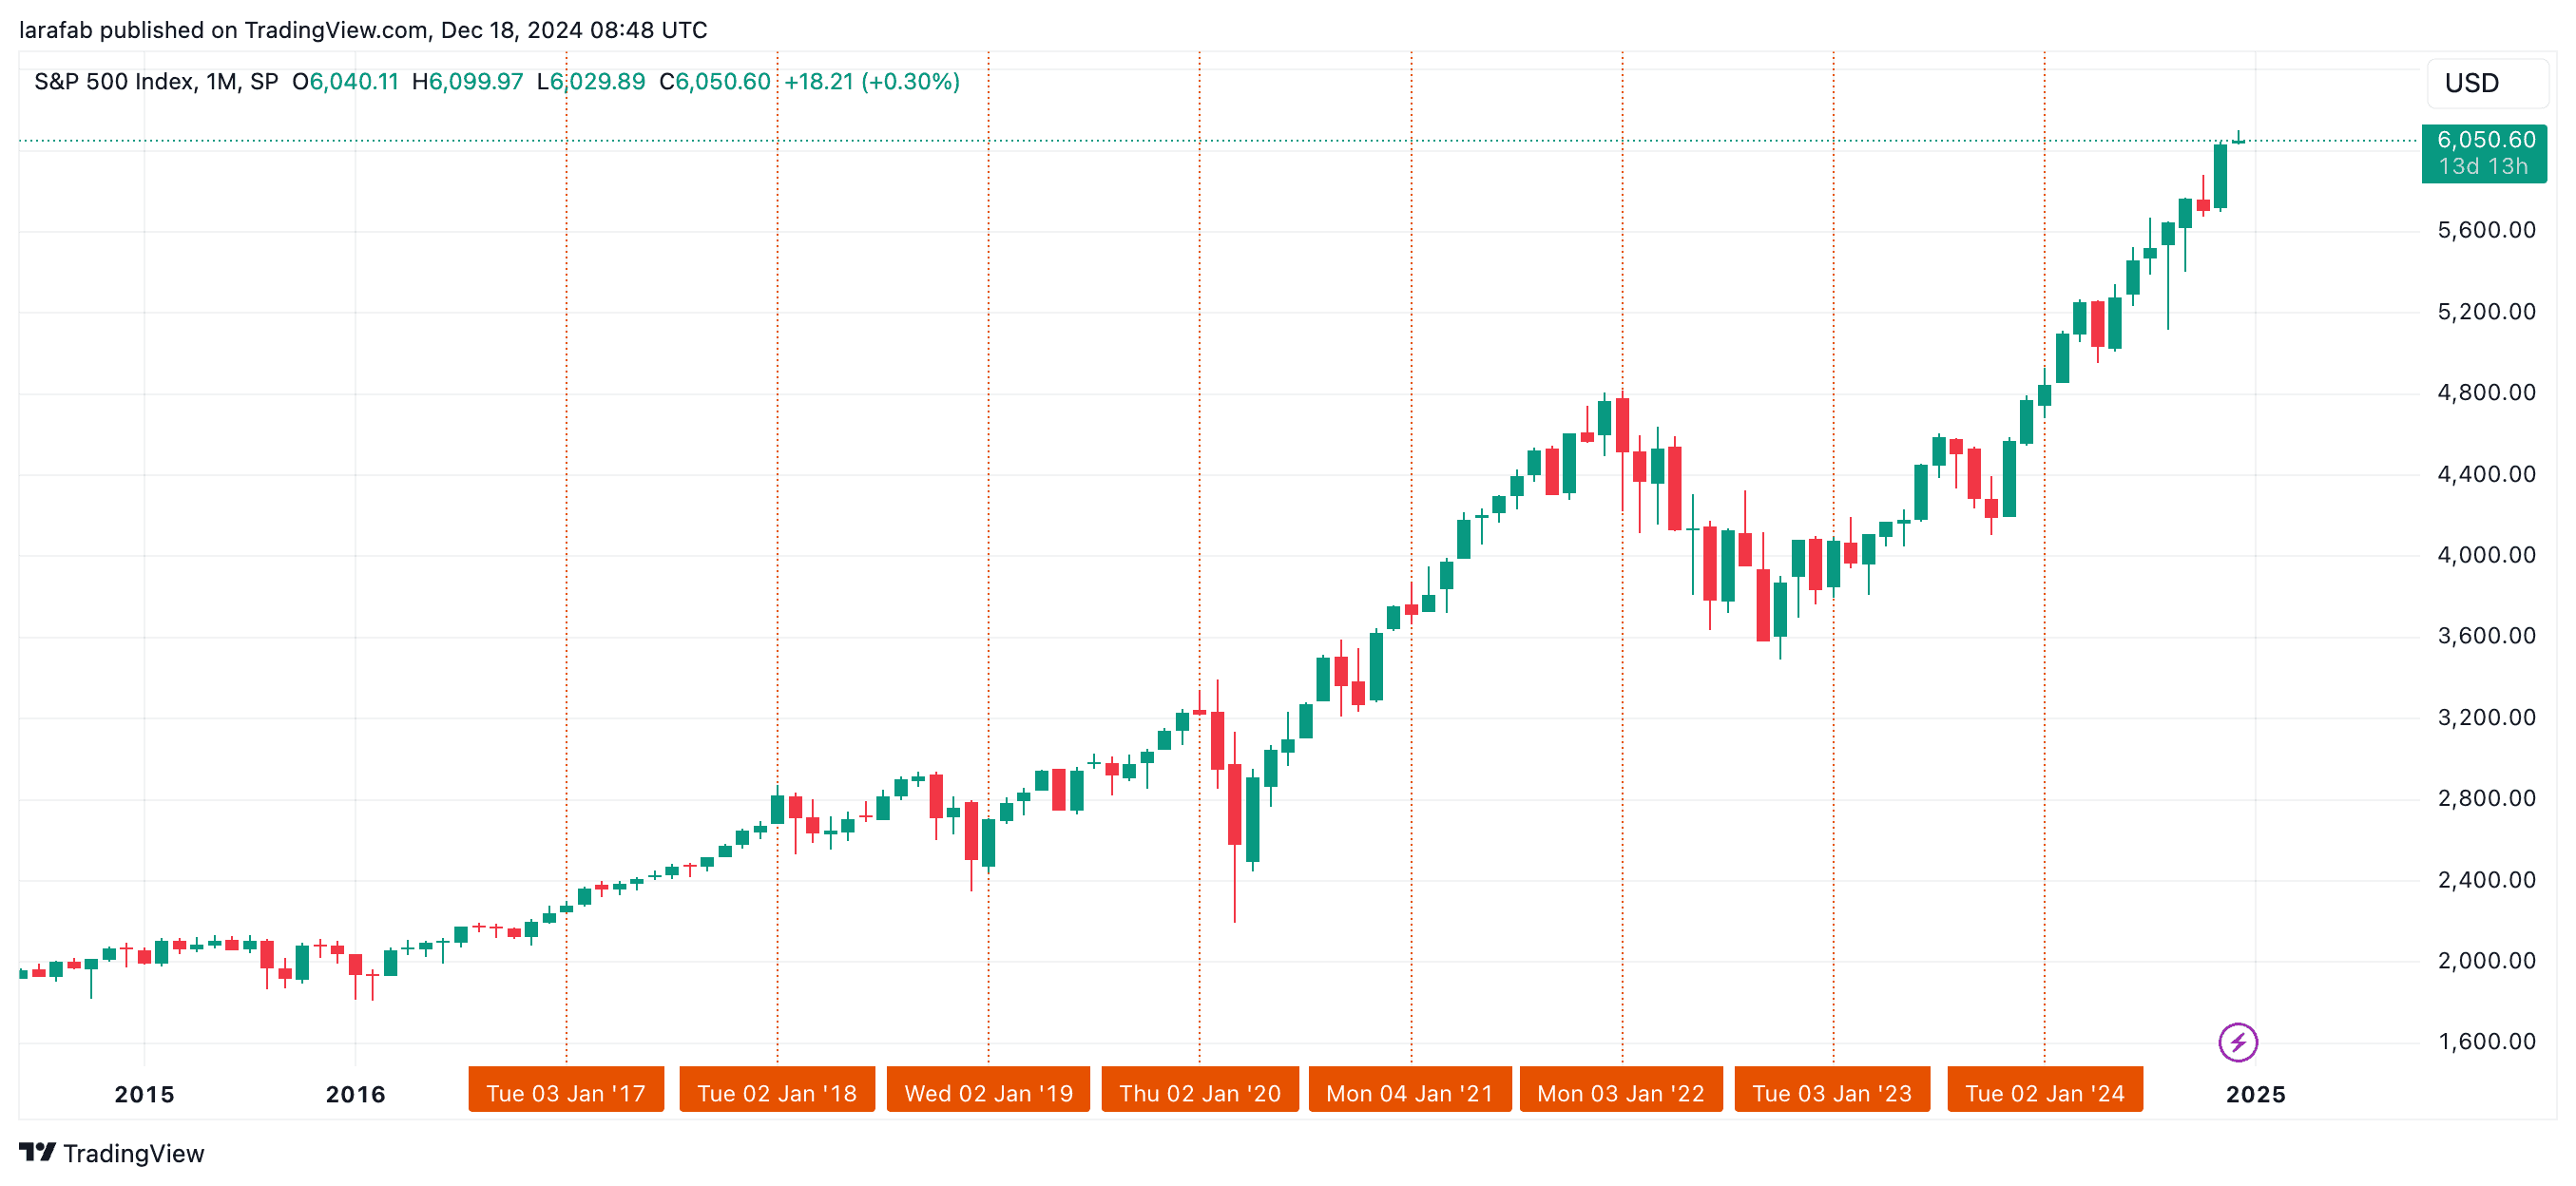
Then 2024 shattered the pattern. The S&P 500 declined on every single trading day between Christmas and New Year's, marking the first "reverse Santa Claus rally" in the index's history. The broader December picture was equally grim: the S&P 500 fell 2.37% during December 2024 despite posting 23.3% annual gains.
What overpowered seasonal patterns?
Hawkish Federal Reserve signals suggesting fewer 2025 rate cuts
Rising Treasury yields drawing capital from equities
Profit-taking after substantial year-to-date gains
Persistent inflation concerns
Years that skip the Santa rally have historically preceded bear markets or created better buying opportunities later. But this relationship lacks statistical power—the S&P 500 generates positive annual returns roughly two-thirds of the time regardless of December performance.
Why January Breakouts Rarely Hold
The "January Effect"—the theory that stocks, particularly small-caps, outperform in January—once appeared statistically robust. First documented by investment banker Sidney Wachtel in 1942, the pattern showed small-company stocks dramatically outperforming from the 1940s through mid-1970s.
That edge has evaporated. Research from Goldman Sachs in 2017 declared the January Effect dead, pointing to two decades of diminishing returns. Recent data confirms this deterioration:
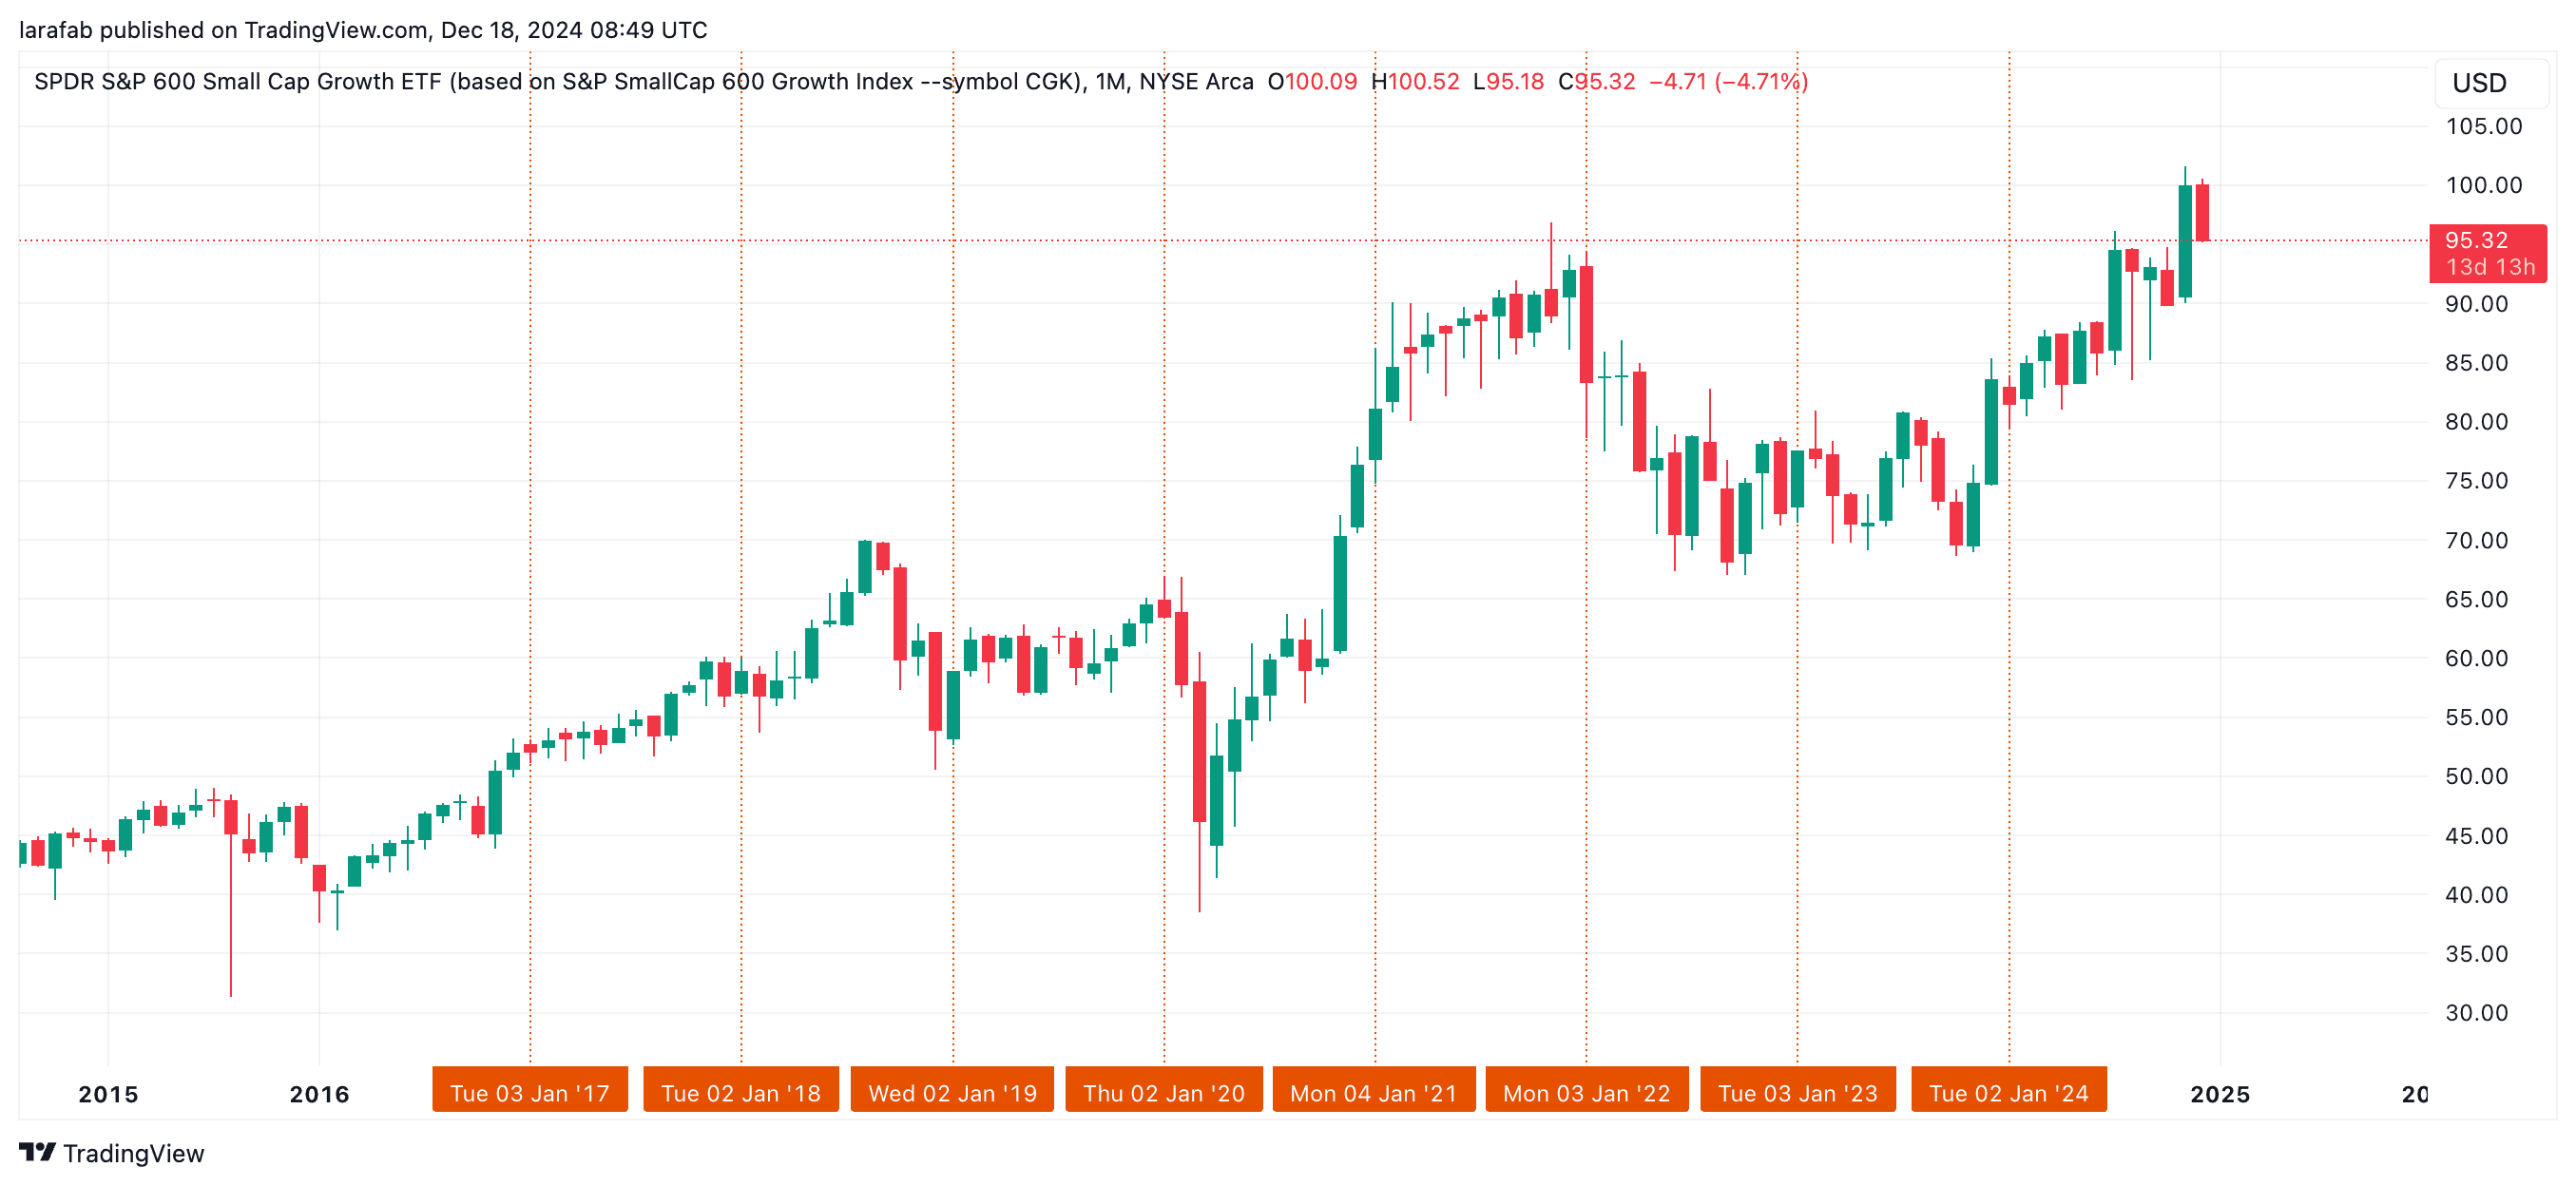
January 2024: Small-caps fell 3.89%, lagging large-caps by 528 basis points
January 2025: Both segments gained roughly 2.5-2.7%—no small-cap advantage
Since 2000, January has been the top-performing month only four times
The edge migrated and diluted:
Algorithmic trading arbitraged away the most obvious patterns
Tax-loss harvesting became more sophisticated and year-round
Passive investing reduced calendar-sensitive flows
Market efficiency compressed anomalies into narrower opportunities
Modern analysis from Investing.com shows November and April now generate stronger average returns than January, while September remains the weakest month.
The False Breakout Trap
Thin year-end liquidity creates perfect conditions for false breakouts—price movements that temporarily breach key levels before reversing sharply. When fewer participants trade, technical patterns become unreliable.
Characteristics of thin-market false breakouts:
Breakouts occur without corresponding volume increases
Prices quickly reverse back into prior trading ranges
Stop-loss orders get triggered unnecessarily
Momentum indicators give contradictory signals
The damage compounds when traders mistake these moves for genuine trend changes. Amateur traders enter positions during apparent breakouts, only to watch professionals push prices back, capitalizing on temporary strength.
Market technician Jonathan Krinsky captured this dynamic perfectly when analyzing 2024 patterns, noting that false breakouts become more likely when markets fail to hold above key levels during low-volume periods.
What Year-End Rallies Actually Signal
Rather than predictive power, year-end market movements reflect three mechanical forces:
Portfolio window-dressing: Fund managers adjust holdings to show attractive positions in year-end reports, creating artificial buying pressure in winners and selling pressure in losers.
Calendar-based rebalancing: Passive investment funds managing relative to fixed-income indices concentrate trading on month-end, particularly December's final days.
Tax-motivated trades: Individual investors execute last-minute tax-loss harvesting, creating selling pressure followed by January reinvestment—but this dynamic is now spread throughout the year rather than concentrated.
The 2025 market environment shows signs favoring a potential Santa rally: easing inflation, strong corporate earnings, and potential Federal Reserve rate cuts. Yet macroeconomic headwinds can overwhelm these tailwinds instantly, as 2024 demonstrated.
Building Better Year-End Discipline
Sophisticated investors treat the year-end period not as opportunity but as increased risk requiring defensive positioning:
Reduce position sizes during known thin-liquidity windows to limit market-impact costs
Widen stop-losses to account for increased volatility from reduced order-book depth
Question breakouts that lack volume confirmation—wait for genuine participation before acting
Rebalance strategically rather than chasing momentum in artificially thin markets
The most valuable year-end activity isn't capturing seasonal patterns but conducting portfolio reviews, tax planning, and strategic positioning for normalized January trading when institutional flows return.
Markets don't disappear during holidays, but they fundamentally change character. Price movements during this period tell you more about market structure than underlying value. The smartest investors recognize that and adjust accordingly—focusing on fundamentals that persist beyond calendar quirks.
For investors seeking tools that help distinguish signal from noise across all market conditions, platforms like Surmount offer systematic approaches to portfolio management that don't rely on fleeting seasonal effects. By automating disciplined strategies and removing emotional decision-making, technology helps investors maintain consistency regardless of temporary liquidity distortions.

Automate any portfolio using data-driven strategies made by top creators & professional investors. Turn any investment idea into an automated, testable, and sharable strategy.


