Decoding Big Tech CapEx: How to Spot Growth Before the Market Does
Surmount Blogs
A practical guide to interpreting tech giants’ capital expenditures and using systematic strategies to uncover early growth opportunities.

The largest tech players in the market have once again come under the spotlight, following unprecedented announcements of capital expenditure increases for 2026. Alphabet, Amazon, Microsoft, and Meta are collectively expected to spend nearly $600 billion this year to fuel their AI build-outs, marking a surge of more than 60% over the previous year.
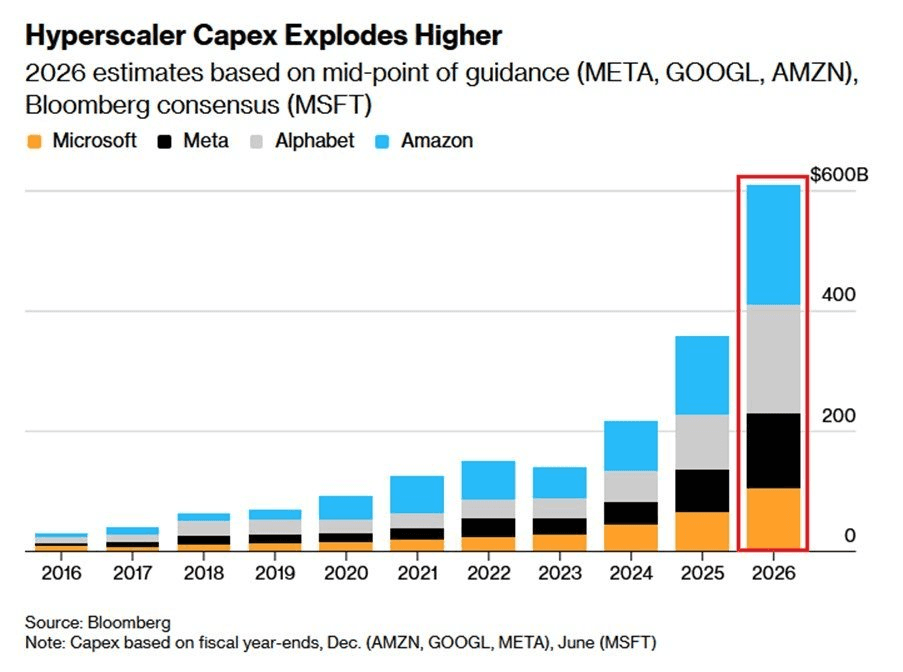
This unprecedented boom in AI investments has rightfully been turning heads in the market given the sheer scale of CapEx spend. To many investors, this aggressive jump in the numbers signals a clear opportunity of where to focus their attention in 2026.
Capex As A Signal
Capital expenditure can potentially be one of the most reliable leading indicators of market cycles. This is because they represent a company’s forward-looking commitment to growth and capacity expansion. Even more so, when the top players in a space are all investing aggressively at the same time, it often signals a synchronized expansion in demand that could actually ripple through the entire supply chain.
The CapEx decisions of the largest hyperscalers, which happen to make up the bulk of market capitalization of the S&P 500, can help investors separate signal from noise in an otherwise volatile market. This is important because those following momentum-based strategies are typically influenced by price movements that come about as a result of rumors, sentiment, or short-term news. On the other hand, following CapEx can be far more rooted in tangible and strategic decision-making.
When tech giants deploy hard cash into infrastructure commitments, which cannot be easily reversed, they are essentially sending a much clearer message about where future demand is heading. Following this flow of money allows investors to anticipate which segments of the semiconductor ecosystem are likely to see growth before it appears in stock prices, or even in revenue reports.
Actually following this approach, however, requires more than just looking at the headline numbers, and instead entails a far more systematic strategy—one that considers why the spending is happening, what it’s being spent on, and where we are in the CapEx cycle.
A Systematic Approach to Interpreting CapEx Trends
For investors, following a battle-tested framework for analyzing CapEx is essential to turn raw spending numbers into actionable insights. Simply noting that a company is spending more isn’t enough. Instead, one must take on a more structured lens:
Classify the Spending
Not all CapEx is the same. Breaking it down into distinct categories helps investors understand the strategic intent behind the dollars:
Maintenance CapEx: This is the money a company spends to keep existing operations running smoothly. While necessary, rising maintenance CapEx relative to revenue can signal inefficiencies or a business model under stress.
Growth CapEx: These investments fund expansion. When paired with a strong return on invested capital (ROIC), growth CapEx can indicate that a company is building a long-term compounding advantage. Investors often see this as the sweet spot for identifying future winners.
Defensive CapEx: Spending aimed at keeping pace with competitors rather than capturing new markets. This type of investment protects market share but rarely generates outsized returns. In fast-moving sectors like AI or semiconductors, defensive CapEx is common and should be interpreted cautiously.
Assess the Capex Cycle
Understanding where a sector sits in its CapEx cycle is critical for timing investment decisions. Industries move through distinct phases, and CapEx patterns often reveal them before revenue or profit trends appear.
Opportunity Zone (Low CapEx): In this phase, companies have spent minimally for several years, often letting equipment age or deferring maintenance. Supply tightens while demand remains stable or grows, creating the potential for outsized margins once new production is added.
Here, investors should look for “survivors”—companies with strong balance sheets that can capitalize when the cycle turns. Entry at this stage positions you ahead of price spikes or volume-driven growth.
Expansion Phase (Moderate CapEx): Companies begin increasing investments to expand capacity and capture growing demand. This is often where early gains are realized, as supply and demand start to balance. Tracking which companies are investing strategically versus defensively can help identify likely winners.
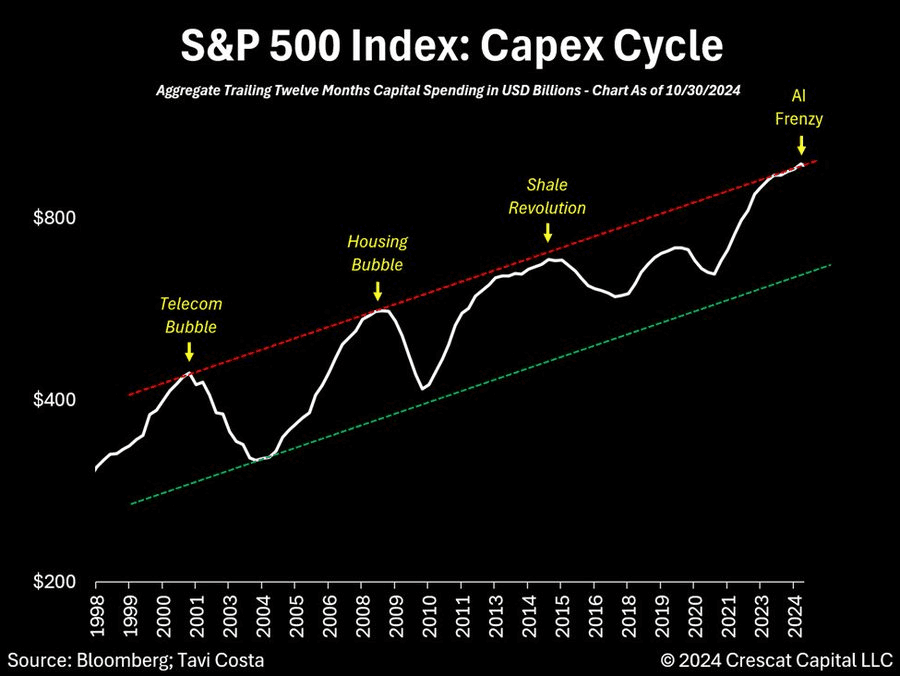
Danger Zone (Peak CapEx): When nearly every player announces record investments, the cycle may be reaching its peak. Overbuilding can lead to oversupply, pricing pressure, and compressed margins.
Signs include “me-too” announcements and rapidly rising capacity across competitors. Investors should consider trimming positions or pivoting to businesses benefiting indirectly from the infrastructure being built.
Analyzing CapEx trends relative to industry peers can be very useful, as investors can anticipate supply bottlenecks, identify growth windows, and avoid late-cycle risks before they show up in earnings reports.
Examine the allocation
Big tech isn’t just just blanket spending on “AI Infrastructure”. Where a company chooses to spend its capital can be just as important—if not more—than how much it spends.
Investors should dig into the specific segments, technologies, and asset types receiving investment, because this often reveals where future growth and margins will concentrate.
For example, in the semiconductor ecosystem, spending can be directed toward:
Logic chips (GPUs, CPUs, ASICs, TPUs), which can signal strong demand for compute-heavy applications, AI infrastructure, or data center expansion. Companies investing heavily here are positioning for premium growth opportunities.
Memory (DRAM, HBM, NAND): Allocation toward advanced memory often indicates high-margin opportunities, whereas heavy spending on commodity DRAM may reflect defensive or cyclical moves.
Advanced packaging and semicap equipment: Reveals that the company is pursuing technical differentiation, which can translate into pricing power and structural advantage.
General infrastructure or real estate: Often necessary but less directly tied to high-margin growth.
By mapping CapEx allocation across these categories, investors can identify which segments are likely to benefit first from spending waves, and by extension, determine where the competitive edge in the space will actually emerge.
Evaluate Timing and Funding
As all things in investing, time horizons are critical for any CapEx oriented investment strategy. As such, understanding how long it takes to translate spending into productive capacity is critical.
Lead time varies dramatically across industries and even within subsectors. For example, building a semiconductor fab can take multiple years, meaning today’s investment will impact supply well into the future. Conversely, scaling a software platform or cloud infrastructure may take only months, leading to a faster, but shorter-lived, market impact.
Investors need to match the lead time of the investment with the expected market cycle to anticipate when supply constraints or surges will actually materialize.
Equally important is the source of funding. CapEx financed through strong cash flow indicates disciplined growth and reduces the risk of financial strain. Debt-funded CapEx can accelerate expansion but also magnifies risk, particularly if market conditions deteriorate. High debt exposure in late-stage CapEx cycles can create pressure for asset sales, margin compression, or share dilution.
This dual lens separates smart, strategic spending from aggressive or precarious overextension, providing a clearer view of risk-adjusted upside.
Investor Takeaway
By systematically breaking down CapEx in this way, investors can identify leading indicators of growth, margin pressure, and strategic winners long before traditional financial metrics reflect the trends. Yet parsing industry cycles, allocation patterns, and timing requires constant attention and disciplined analysis—tasks that can be overwhelming for even experienced investors.
Surmount’s AI-powered strategies simplify this process, automatically analyzing company spending, industry trends, and risk-adjusted opportunities to highlight actionable insights. By leveraging these tools, investors can maintain a systematic, rules-based approach, reduce emotional decision-making, and confidently position their portfolios to capture growth opportunities in tech and beyond without manually tracking every capital expenditure nuance.

Automate any portfolio using data-driven strategies made by top creators & professional investors. Turn any investment idea into an automated, testable, and sharable strategy.


